| Red | Green | Blue | |
| z | 17.64 | ||
| znorm | Inf | ||
| sky | -NaN | -Inf | -NaN |
| S/N | 27.2 | 45.9 | 48.5 |
| S/N(c) | 0.0 | 0.0 | 0.0 |
| SN(E/C) |

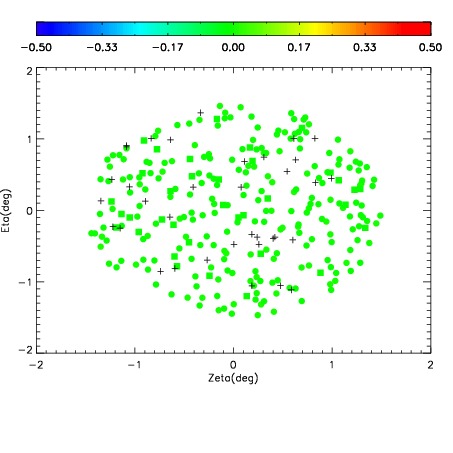
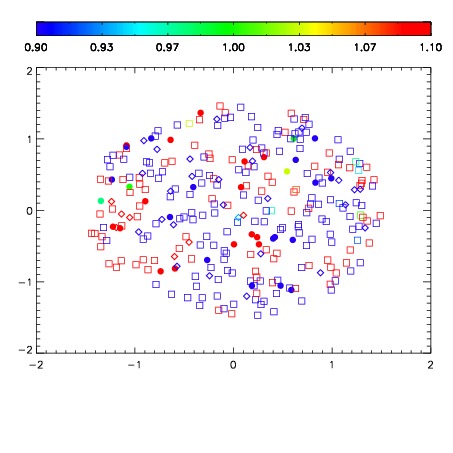


| Frame | Nreads | Zeropoints | Mag plots | Spatial mag deviation | Spatial sky 16325A emission deviations (filled: sky, open: star) | Spatial sky continuum emission | Spatial sky telluric CO2 absorption deviations (filled: H < 10) | |||||||||||||||||||||||
| 0 | 0 |
|
|
|
|
|
|
| IPAIR | NAME | SHIFT | NEWSHIFT | S/N | NAME | SHIFT | NEWSHIFT | S/N |
| 0 | 12630035 | 0.482347 | 0.00000 | 19.0817 | 12630033 | 0.00000 | 0.482347 | 18.8123 |
| 1 | 12630038 | 0.480354 | 0.00199300 | 19.1343 | 12630037 | -0.000959987 | 0.483307 | 19.1272 |
| 2 | 12630034 | 0.481987 | 0.000360012 | 19.0874 | 12630036 | -0.000900217 | 0.483247 | 19.1148 |
| 3 | 12630039 | 0.481700 | 0.000647008 | 17.2249 | 12630040 | -0.000431021 | 0.482778 | 18.6940 |