| Red | Green | Blue | |
| z | 17.64 | ||
| znorm | Inf | ||
| sky | -Inf | -Inf | -Inf |
| S/N | 36.5 | 59.6 | 64.0 |
| S/N(c) | 0.0 | 0.0 | 0.0 |
| SN(E/C) |


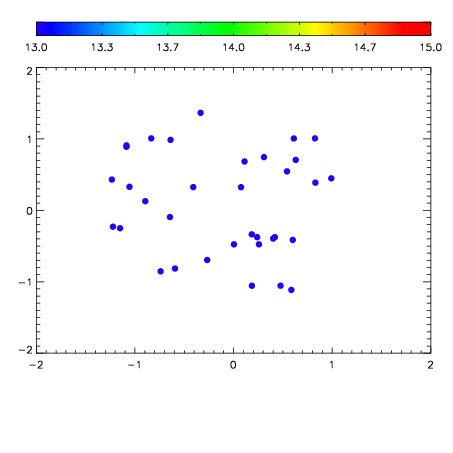

| Frame | Nreads | Zeropoints | Mag plots | Spatial mag deviation | Spatial sky 16325A emission deviations (filled: sky, open: star) | Spatial sky continuum emission | Spatial sky telluric CO2 absorption deviations (filled: H < 10) | |||||||||||||||||||||||
| 0 | 0 |
|
|
|
|
|
|
| IPAIR | NAME | SHIFT | NEWSHIFT | S/N | NAME | SHIFT | NEWSHIFT | S/N |
| 0 | 12690042 | 0.494476 | 0.00000 | 19.1046 | 12690040 | 0.000150833 | 0.494325 | 19.1404 |
| 1 | 12690038 | 0.492820 | 0.00165600 | 19.1694 | 12690036 | -0.000617121 | 0.495093 | 19.1519 |
| 2 | 12690039 | 0.493420 | 0.00105599 | 19.1252 | 12690041 | 0.000466000 | 0.494010 | 19.1475 |
| 3 | 12690035 | 0.492750 | 0.00172600 | 19.1147 | 12690037 | -0.000620065 | 0.495096 | 19.1433 |
| 4 | 12690034 | 0.492633 | 0.00184301 | 19.1005 | 12690033 | 0.00000 | 0.494476 | 19.0920 |