| Red | Green | Blue | |
| z | 17.64 | ||
| znorm | Inf | ||
| sky | -Inf | -Inf | -Inf |
| S/N | 19.0 | 34.9 | 37.2 |
| S/N(c) | 0.0 | 0.0 | 0.0 |
| SN(E/C) |
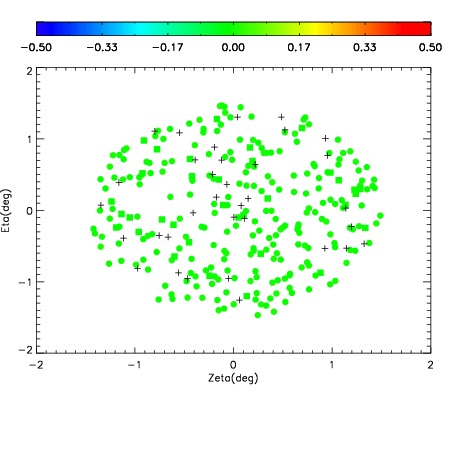
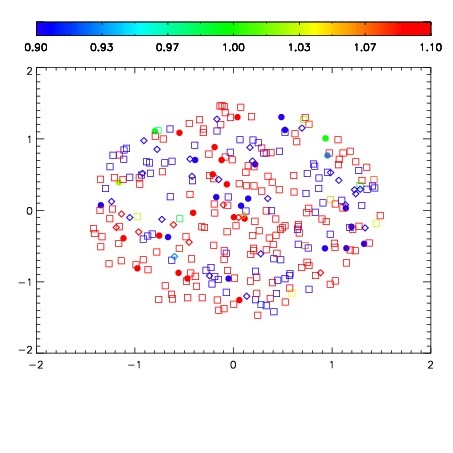
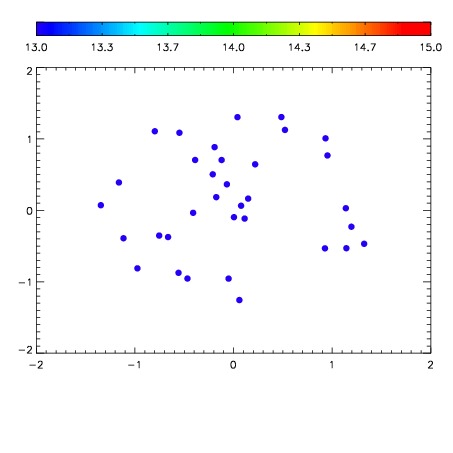

| Frame | Nreads | Zeropoints | Mag plots | Spatial mag deviation | Spatial sky 16325A emission deviations (filled: sky, open: star) | Spatial sky continuum emission | Spatial sky telluric CO2 absorption deviations (filled: H < 10) | |||||||||||||||||||||||
| 0 | 0 |
|
|
|
|
|
|
| IPAIR | NAME | SHIFT | NEWSHIFT | S/N | NAME | SHIFT | NEWSHIFT | S/N |
| 0 | 12660065 | 0.486840 | 0.00000 | 18.2791 | 12660066 | -0.000807420 | 0.487647 | 18.2049 |
| 1 | 12660060 | 0.486140 | 0.000699997 | 18.6816 | 12660059 | 0.00000 | 0.486840 | 18.7794 |
| 2 | 12660061 | 0.486566 | 0.000274003 | 18.5983 | 12660063 | 0.000447624 | 0.486392 | 18.6247 |
| 3 | 12660064 | 0.486318 | 0.000522017 | 18.5020 | 12660062 | 0.00109589 | 0.485744 | 18.5680 |