| Red | Green | Blue | |
| z | 17.64 | ||
| znorm | Inf | ||
| sky | -Inf | -Inf | -Inf |
| S/N | 18.5 | 34.4 | 36.7 |
| S/N(c) | 0.0 | 0.0 | 0.0 |
| SN(E/C) |

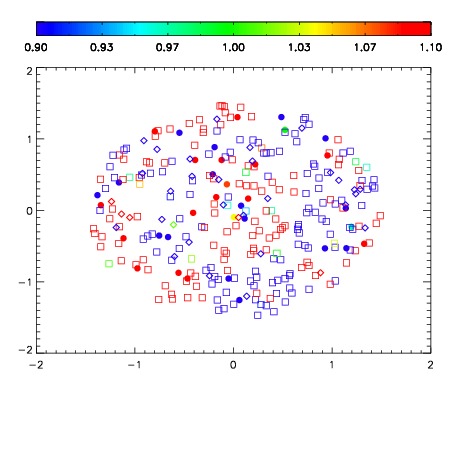
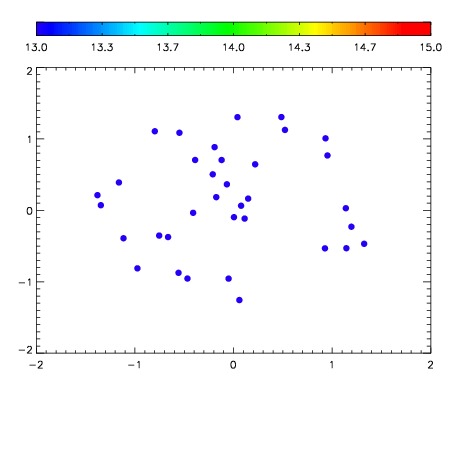

| Frame | Nreads | Zeropoints | Mag plots | Spatial mag deviation | Spatial sky 16325A emission deviations (filled: sky, open: star) | Spatial sky continuum emission | Spatial sky telluric CO2 absorption deviations (filled: H < 10) | |||||||||||||||||||||||
| 0 | 0 |
|
|
|
|
|
|
| IPAIR | NAME | SHIFT | NEWSHIFT | S/N | NAME | SHIFT | NEWSHIFT | S/N |
| 0 | 12680065 | 0.488022 | 0.00000 | 18.9406 | 12680066 | -0.00118398 | 0.489206 | 18.9291 |
| 1 | 12680064 | 0.487509 | 0.000512987 | 18.7938 | 12680063 | -0.00128473 | 0.489307 | 18.7095 |
| 2 | 12680061 | 0.488020 | 1.99676e-06 | 18.1252 | 12680062 | -0.00172441 | 0.489746 | 17.5774 |
| 3 | 12680060 | 0.487172 | 0.000849992 | 17.4032 | 12680059 | 0.00000 | 0.488022 | 17.4928 |