| Red | Green | Blue | |
| z | 17.64 | ||
| znorm | Inf | ||
| sky | -Inf | -Inf | -Inf |
| S/N | 22.5 | 39.9 | 41.5 |
| S/N(c) | 0.0 | 0.0 | 0.0 |
| SN(E/C) |
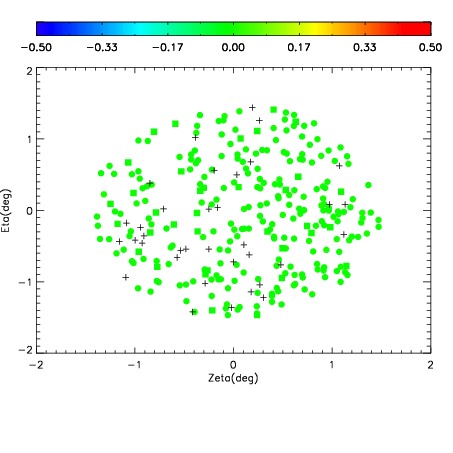
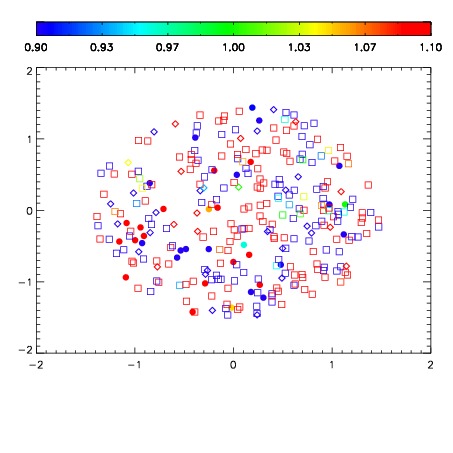
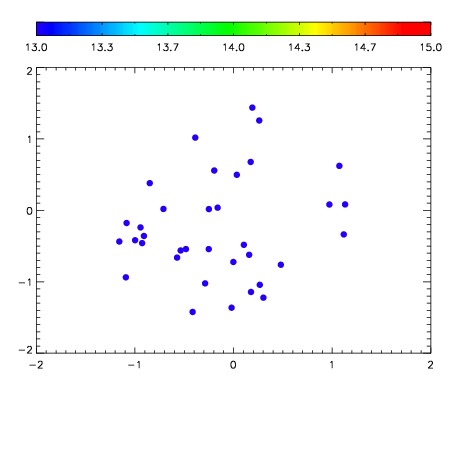

| Frame | Nreads | Zeropoints | Mag plots | Spatial mag deviation | Spatial sky 16325A emission deviations (filled: sky, open: star) | Spatial sky continuum emission | Spatial sky telluric CO2 absorption deviations (filled: H < 10) | |||||||||||||||||||||||
| 0 | 0 |
|
|
|
|
|
|
| IPAIR | NAME | SHIFT | NEWSHIFT | S/N | NAME | SHIFT | NEWSHIFT | S/N |
| 0 | 12170016 | 0.496174 | 0.00000 | 18.7577 | 12170011 | 0.00000 | 0.496174 | 18.7060 |
| 1 | 12170017 | 0.496052 | 0.000122011 | 18.8911 | 12170018 | 0.00166101 | 0.494513 | 18.9043 |
| 2 | 12170012 | 0.495628 | 0.000546008 | 18.8413 | 12170014 | 0.000291092 | 0.495883 | 18.7321 |
| 3 | 12170013 | 0.495966 | 0.000208020 | 18.8347 | 12170015 | 0.000465771 | 0.495708 | 18.7074 |