| Red | Green | Blue | |
| z | 17.64 | ||
| znorm | Inf | ||
| sky | -Inf | -Inf | -Inf |
| S/N | 23.3 | 38.6 | 41.8 |
| S/N(c) | 0.0 | 0.0 | 0.0 |
| SN(E/C) |
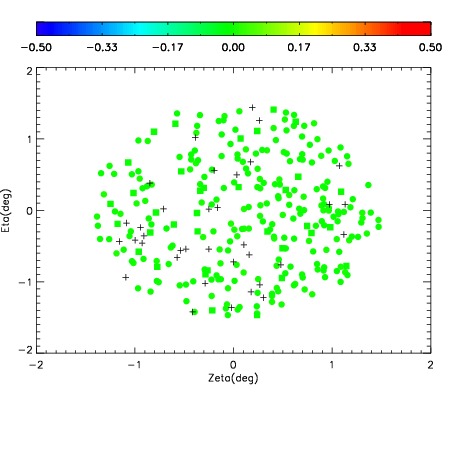

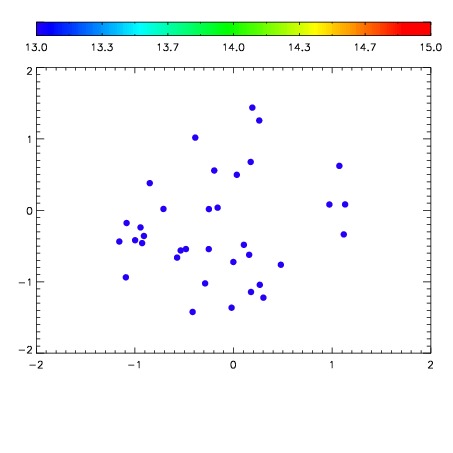

| Frame | Nreads | Zeropoints | Mag plots | Spatial mag deviation | Spatial sky 16325A emission deviations (filled: sky, open: star) | Spatial sky continuum emission | Spatial sky telluric CO2 absorption deviations (filled: H < 10) | |||||||||||||||||||||||
| 0 | 0 |
|
|
|
|
|
|
| IPAIR | NAME | SHIFT | NEWSHIFT | S/N | NAME | SHIFT | NEWSHIFT | S/N |
| 0 | 12630013 | 0.484343 | 0.00000 | 18.0870 | 12630014 | 0.000125066 | 0.484218 | 18.0070 |
| 1 | 12630016 | 0.482901 | 0.00144199 | 19.1075 | 12630018 | 0.000376250 | 0.483967 | 19.1046 |
| 2 | 12630017 | 0.483436 | 0.000907004 | 19.1050 | 12630011 | 0.00000 | 0.484343 | 19.0740 |
| 3 | 12630012 | 0.484304 | 3.89814e-05 | 18.3290 | 12630015 | 2.31537e-05 | 0.484320 | 18.8617 |