| Red | Green | Blue | |
| z | 17.64 | ||
| znorm | Inf | ||
| sky | -Inf | -Inf | -NaN |
| S/N | 26.5 | 46.0 | 49.6 |
| S/N(c) | 0.0 | 0.0 | 0.0 |
| SN(E/C) |
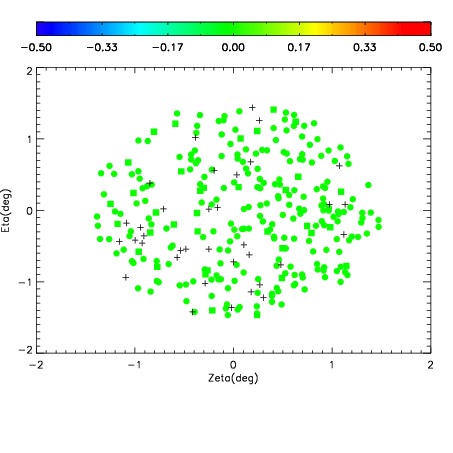
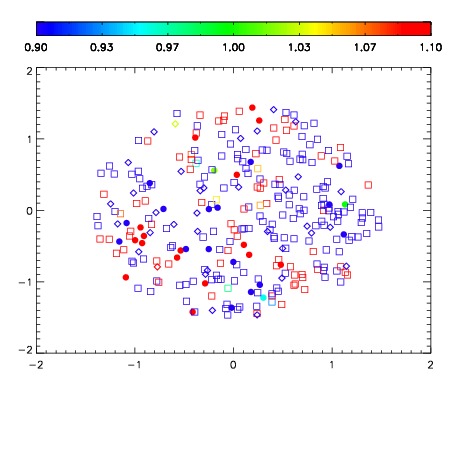
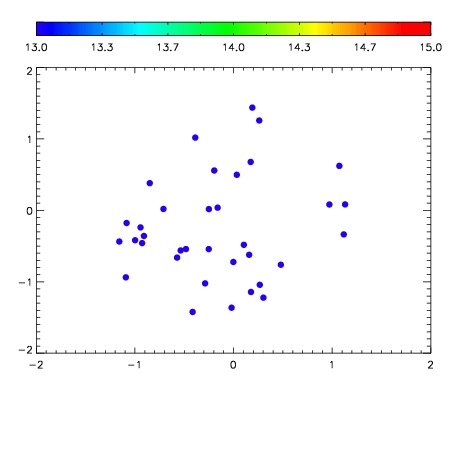

| Frame | Nreads | Zeropoints | Mag plots | Spatial mag deviation | Spatial sky 16325A emission deviations (filled: sky, open: star) | Spatial sky continuum emission | Spatial sky telluric CO2 absorption deviations (filled: H < 10) | |||||||||||||||||||||||
| 0 | 0 |
|
|
|
|
|
|
| IPAIR | NAME | SHIFT | NEWSHIFT | S/N | NAME | SHIFT | NEWSHIFT | S/N |
| 0 | 12690028 | 0.486475 | 0.00000 | 18.8379 | 12690029 | -0.00768314 | 0.494158 | 19.0661 |
| 1 | 12690027 | 0.485546 | 0.000928998 | 19.1333 | 12690025 | -0.00314686 | 0.489622 | 19.1659 |
| 2 | 12690024 | 0.482947 | 0.00352800 | 19.0839 | 12690022 | 0.00000 | 0.486475 | 19.1187 |
| 3 | 12690023 | 0.483641 | 0.00283399 | 18.8052 | 12690026 | -0.00303467 | 0.489510 | 19.0639 |