| Red | Green | Blue | |
| z | 17.64 | ||
| znorm | Inf | ||
| sky | -Inf | -Inf | -Inf |
| S/N | 13.0 | 24.3 | 24.2 |
| S/N(c) | 0.0 | 0.0 | 0.0 |
| SN(E/C) |
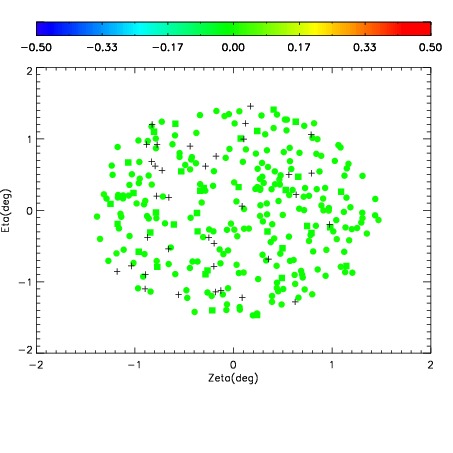
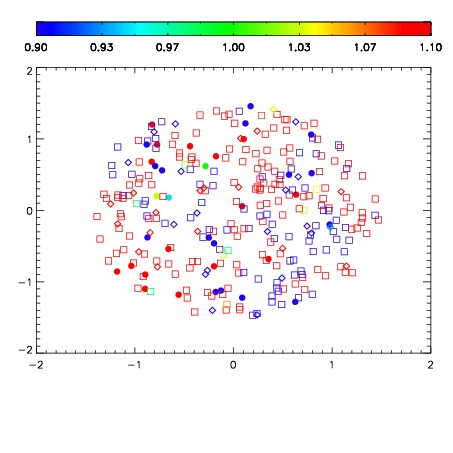
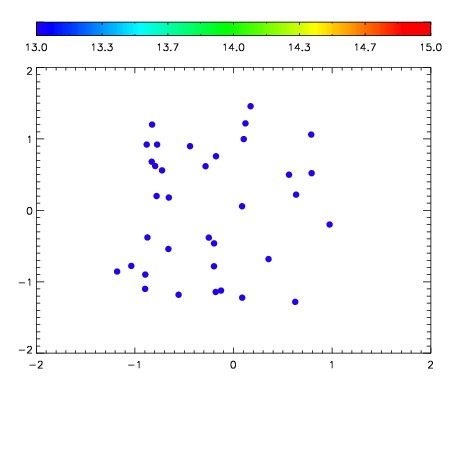

| Frame | Nreads | Zeropoints | Mag plots | Spatial mag deviation | Spatial sky 16325A emission deviations (filled: sky, open: star) | Spatial sky continuum emission | Spatial sky telluric CO2 absorption deviations (filled: H < 10) | |||||||||||||||||||||||
| 0 | 0 |
|
|
|
|
|
|
| IPAIR | NAME | SHIFT | NEWSHIFT | S/N | NAME | SHIFT | NEWSHIFT | S/N |
| 0 | 12130017 | 0.497207 | 0.00000 | 18.5479 | 12130018 | -0.000258721 | 0.497466 | 18.6049 |
| 1 | 12130016 | 0.497090 | 0.000116974 | 18.0852 | 12130015 | -0.00205670 | 0.499264 | 17.8856 |
| 2 | 12130013 | 0.495056 | 0.00215098 | 17.8175 | 12130014 | -0.00214954 | 0.499357 | 17.8511 |
| 3 | 12130012 | 0.495609 | 0.00159800 | 17.0215 | 12130011 | 0.00000 | 0.497207 | 17.6281 |