| Red | Green | Blue | |
| z | 17.64 | ||
| znorm | Inf | ||
| sky | -Inf | -Inf | -Inf |
| S/N | 22.4 | 39.6 | 40.9 |
| S/N(c) | 0.0 | 0.0 | 0.0 |
| SN(E/C) |

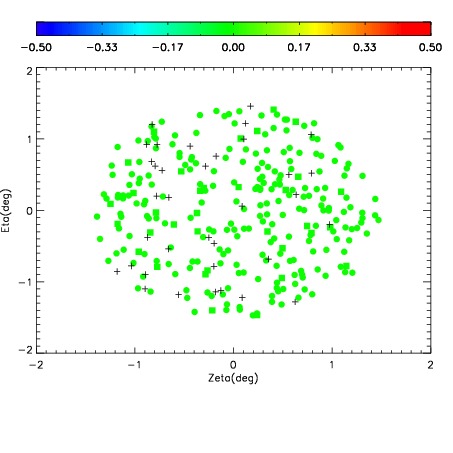
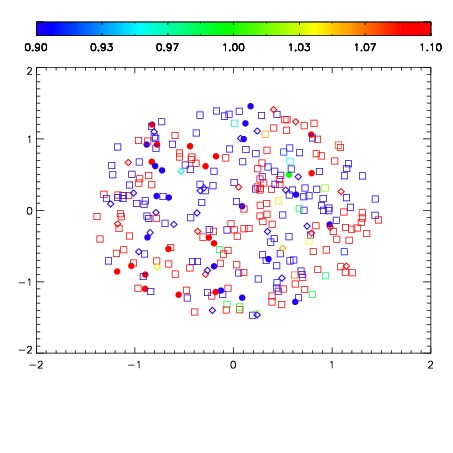
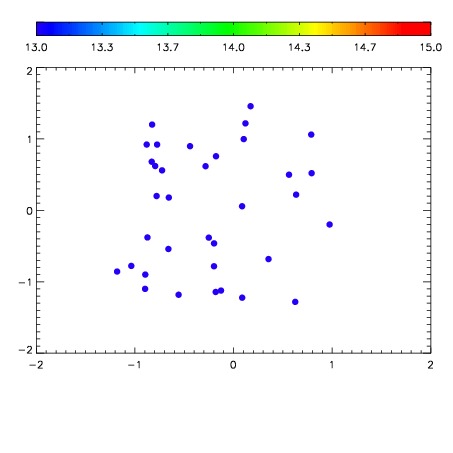

| Frame | Nreads | Zeropoints | Mag plots | Spatial mag deviation | Spatial sky 16325A emission deviations (filled: sky, open: star) | Spatial sky continuum emission | Spatial sky telluric CO2 absorption deviations (filled: H < 10) | |||||||||||||||||||||||
| 0 | 0 |
|
|
|
|
|
|
| IPAIR | NAME | SHIFT | NEWSHIFT | S/N | NAME | SHIFT | NEWSHIFT | S/N |
| 0 | 12190050 | 0.504965 | 0.00000 | 19.0011 | 12190051 | -0.000603295 | 0.505568 | 19.0016 |
| 1 | 12190049 | 0.504904 | 6.10352e-05 | 18.9114 | 12190048 | 0.00198085 | 0.502984 | 18.9377 |
| 2 | 12190046 | 0.504518 | 0.000447035 | 18.8444 | 12190047 | 0.00138400 | 0.503581 | 18.8916 |
| 3 | 12190045 | 0.503859 | 0.00110602 | 18.7861 | 12190044 | 0.00000 | 0.504965 | 18.5505 |