| Red | Green | Blue | |
| z | 17.64 | ||
| znorm | Inf | ||
| sky | -Inf | -NaN | -Inf |
| S/N | 27.6 | 46.8 | 49.1 |
| S/N(c) | 0.0 | 0.0 | 0.0 |
| SN(E/C) |
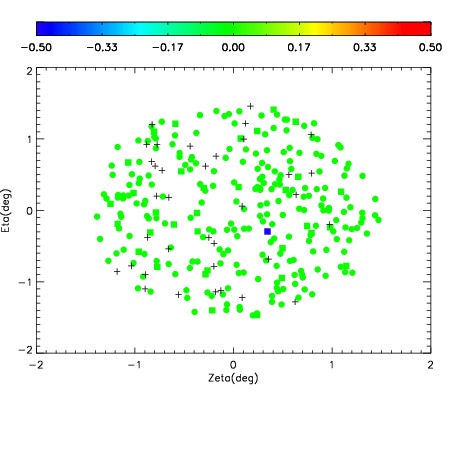
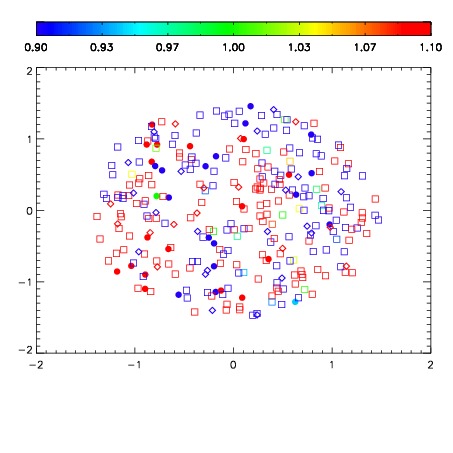
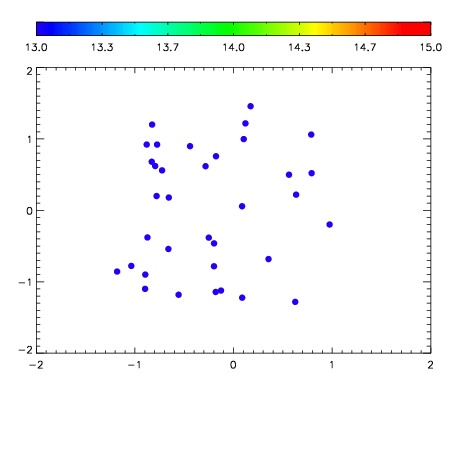

| Frame | Nreads | Zeropoints | Mag plots | Spatial mag deviation | Spatial sky 16325A emission deviations (filled: sky, open: star) | Spatial sky continuum emission | Spatial sky telluric CO2 absorption deviations (filled: H < 10) | |||||||||||||||||||||||
| 0 | 0 |
|
|
|
|
|
|
| IPAIR | NAME | SHIFT | NEWSHIFT | S/N | NAME | SHIFT | NEWSHIFT | S/N |
| 0 | 12370016 | 0.494913 | 0.00000 | 19.1257 | 12370018 | 0.00388395 | 0.491029 | 19.1676 |
| 1 | 12370017 | 0.494857 | 5.59986e-05 | 19.0978 | 12370015 | 0.00509277 | 0.489820 | 19.1184 |
| 2 | 12370012 | 0.493047 | 0.00186601 | 19.0907 | 12370011 | 0.00000 | 0.494913 | 19.0807 |
| 3 | 12370013 | 0.493766 | 0.00114700 | 19.0903 | 12370014 | 0.00521940 | 0.489694 | 19.0616 |