| Red | Green | Blue | |
| z | 17.64 | ||
| znorm | Inf | ||
| sky | -Inf | -Inf | -Inf |
| S/N | 28.7 | 50.0 | 52.1 |
| S/N(c) | 0.0 | 0.0 | 0.0 |
| SN(E/C) |
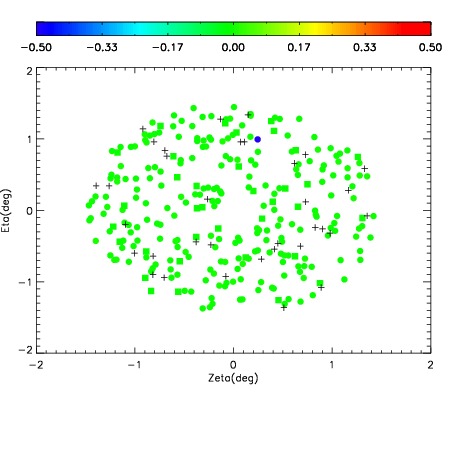
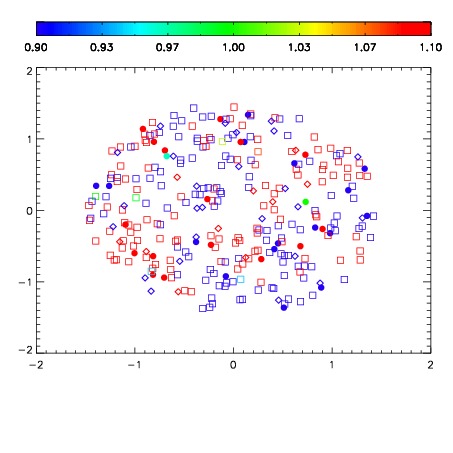


| Frame | Nreads | Zeropoints | Mag plots | Spatial mag deviation | Spatial sky 16325A emission deviations (filled: sky, open: star) | Spatial sky continuum emission | Spatial sky telluric CO2 absorption deviations (filled: H < 10) | |||||||||||||||||||||||
| 0 | 0 |
|
|
|
|
|
|
| IPAIR | NAME | SHIFT | NEWSHIFT | S/N | NAME | SHIFT | NEWSHIFT | S/N |
| 0 | 12680076 | 0.487589 | 0.00000 | 19.0265 | 12680077 | -0.000719569 | 0.488309 | 18.9582 |
| 1 | 12680071 | 0.485109 | 0.00248000 | 19.1186 | 12680073 | -0.00198015 | 0.489569 | 19.0878 |
| 2 | 12680072 | 0.486109 | 0.00148001 | 19.0862 | 12680074 | -0.00213557 | 0.489725 | 19.0877 |
| 3 | 12680075 | 0.486696 | 0.000892997 | 19.0424 | 12680070 | 0.00000 | 0.487589 | 18.9874 |