| Red | Green | Blue | |
| z | 17.64 | ||
| znorm | Inf | ||
| sky | -NaN | -NaN | -Inf |
| S/N | 31.7 | 52.5 | 53.3 |
| S/N(c) | 0.0 | 0.0 | 0.0 |
| SN(E/C) |
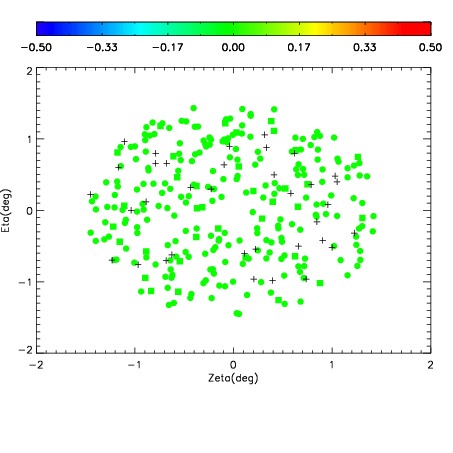


| Frame | Nreads | Zeropoints | Mag plots | Spatial mag deviation | Spatial sky 16325A emission deviations (filled: sky, open: star) | Spatial sky continuum emission | Spatial sky telluric CO2 absorption deviations (filled: H < 10) | |||||||||||||||||||||||
| 0 | 0 |
|
|
|
|
|
|
| IPAIR | NAME | SHIFT | NEWSHIFT | S/N | NAME | SHIFT | NEWSHIFT | S/N |
| 0 | 12560072 | 0.482885 | 0.00000 | 19.2159 | 12560074 | -0.00349118 | 0.486376 | 19.1784 |
| 1 | 12560075 | 0.481147 | 0.00173801 | 19.2270 | 12560077 | 3.98094e-06 | 0.482881 | 19.2219 |
| 2 | 12560076 | 0.481597 | 0.00128800 | 19.2195 | 12560073 | -0.00265635 | 0.485541 | 19.1948 |
| 3 | 12560071 | 0.482817 | 6.80089e-05 | 19.2082 | 12560070 | 0.00000 | 0.482885 | 19.1535 |