| Red | Green | Blue | |
| z | 17.64 | ||
| znorm | Inf | ||
| sky | -Inf | -Inf | -Inf |
| S/N | 18.3 | 33.4 | 36.2 |
| S/N(c) | 0.0 | 0.0 | 0.0 |
| SN(E/C) |


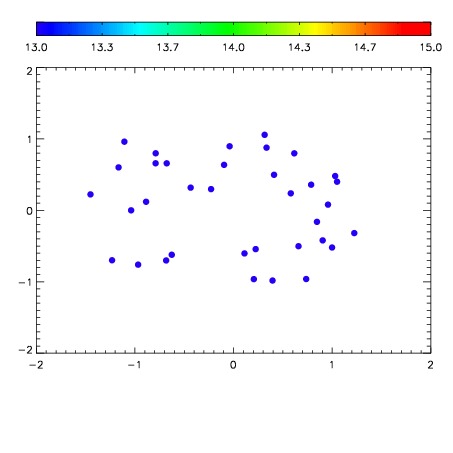

| Frame | Nreads | Zeropoints | Mag plots | Spatial mag deviation | Spatial sky 16325A emission deviations (filled: sky, open: star) | Spatial sky continuum emission | Spatial sky telluric CO2 absorption deviations (filled: H < 10) | |||||||||||||||||||||||
| 0 | 0 |
|
|
|
|
|
|
| IPAIR | NAME | SHIFT | NEWSHIFT | S/N | NAME | SHIFT | NEWSHIFT | S/N |
| 0 | 12660072 | 0.487707 | 0.00000 | 18.5901 | 12660073 | -0.000379581 | 0.488087 | 18.5579 |
| 1 | 12660076 | 0.487662 | 4.50015e-05 | 18.6102 | 12660077 | 0.000419382 | 0.487288 | 18.7003 |
| 2 | 12660075 | 0.486465 | 0.00124198 | 18.4975 | 12660074 | -0.000832550 | 0.488540 | 18.4388 |
| 3 | 12660071 | 0.486540 | 0.00116700 | 18.4710 | 12660070 | 0.00000 | 0.487707 | 17.9898 |