| Red | Green | Blue | |
| z | 17.64 | ||
| znorm | Inf | ||
| sky | -Inf | -Inf | -Inf |
| S/N | 17.7 | 33.0 | 34.6 |
| S/N(c) | 0.0 | 0.0 | 0.0 |
| SN(E/C) |
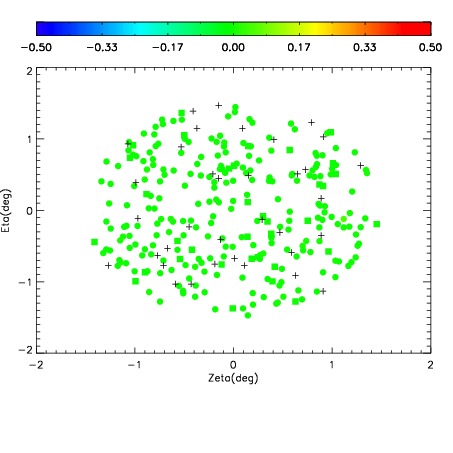


| Frame | Nreads | Zeropoints | Mag plots | Spatial mag deviation | Spatial sky 16325A emission deviations (filled: sky, open: star) | Spatial sky continuum emission | Spatial sky telluric CO2 absorption deviations (filled: H < 10) | |||||||||||||||||||||||
| 0 | 0 |
|
|
|
|
|
|
| IPAIR | NAME | SHIFT | NEWSHIFT | S/N | NAME | SHIFT | NEWSHIFT | S/N |
| 0 | 12710045 | 0.488724 | 0.00000 | 18.9634 | 12710046 | -0.00151515 | 0.490239 | 19.0800 |
| 1 | 12710040 | 0.487871 | 0.000853002 | 18.9589 | 12710039 | 0.00000 | 0.488724 | 18.9675 |
| 2 | 12710041 | 0.488086 | 0.000638008 | 18.3598 | 12710042 | -0.000702100 | 0.489426 | 17.6604 |
| 3 | 12710044 | 0.488454 | 0.000269979 | 17.4387 | 12710043 | -0.000182062 | 0.488906 | 17.3041 |