| Red | Green | Blue | |
| z | 17.64 | ||
| znorm | Inf | ||
| sky | -Inf | -Inf | -Inf |
| S/N | 29.1 | 50.0 | 53.1 |
| S/N(c) | 0.0 | 0.0 | 0.0 |
| SN(E/C) |

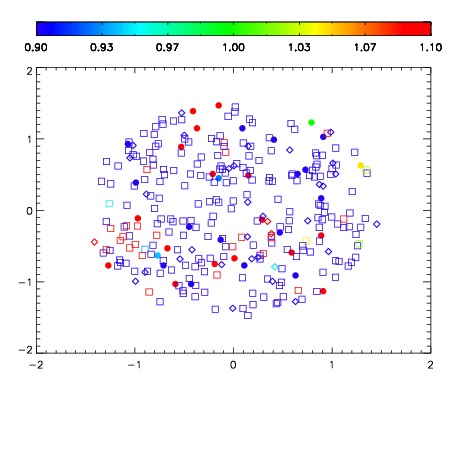


| Frame | Nreads | Zeropoints | Mag plots | Spatial mag deviation | Spatial sky 16325A emission deviations (filled: sky, open: star) | Spatial sky continuum emission | Spatial sky telluric CO2 absorption deviations (filled: H < 10) | |||||||||||||||||||||||
| 0 | 0 |
|
|
|
|
|
|
| IPAIR | NAME | SHIFT | NEWSHIFT | S/N | NAME | SHIFT | NEWSHIFT | S/N |
| 0 | 12730075 | 0.484312 | 0.00000 | 17.0318 | 12730074 | -0.000249371 | 0.484561 | 18.1629 |
| 1 | 12730068 | 0.483340 | 0.000972003 | 19.1185 | 12730069 | -0.000348964 | 0.484661 | 19.1379 |
| 2 | 12730072 | 0.483428 | 0.000883996 | 19.0880 | 12730070 | -0.000288650 | 0.484601 | 19.0997 |
| 3 | 12730067 | 0.480679 | 0.00363299 | 19.0836 | 12730066 | 0.00000 | 0.484312 | 19.0516 |
| 4 | 12730071 | 0.483402 | 0.000909984 | 19.0535 | 12730073 | -0.00188663 | 0.486199 | 19.0280 |