| Red | Green | Blue | |
| z | 17.64 | ||
| znorm | Inf | ||
| sky | -Inf | -Inf | -Inf |
| S/N | 24.2 | 43.0 | 44.4 |
| S/N(c) | 0.0 | 0.0 | 0.0 |
| SN(E/C) |


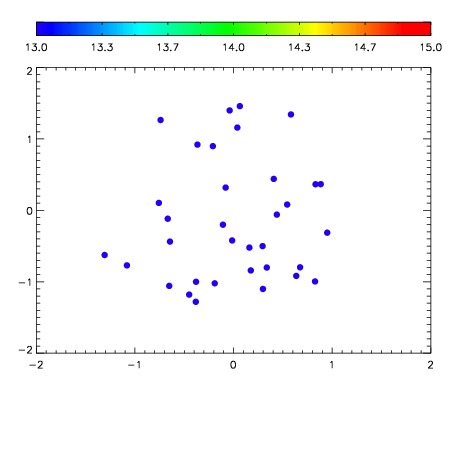

| Frame | Nreads | Zeropoints | Mag plots | Spatial mag deviation | Spatial sky 16325A emission deviations (filled: sky, open: star) | Spatial sky continuum emission | Spatial sky telluric CO2 absorption deviations (filled: H < 10) | |||||||||||||||||||||||
| 0 | 0 |
|
|
|
|
|
|
| IPAIR | NAME | SHIFT | NEWSHIFT | S/N | NAME | SHIFT | NEWSHIFT | S/N |
| 0 | 12570060 | 0.490113 | 0.00000 | 19.1470 | 12570062 | -0.00127477 | 0.491388 | 19.0810 |
| 1 | 12570061 | 0.490113 | 0.00000 | 19.0716 | 12570059 | 0.000264567 | 0.489848 | 19.0201 |
| 2 | 12570057 | 0.490057 | 5.59986e-05 | 18.9505 | 12570058 | 0.000216526 | 0.489896 | 18.8106 |
| 3 | 12570056 | 0.489467 | 0.000645995 | 18.7748 | 12570055 | 0.00000 | 0.490113 | 18.7240 |