| Red | Green | Blue | |
| z | 17.64 | ||
| znorm | Inf | ||
| sky | -NaN | -Inf | -NaN |
| S/N | 26.7 | 44.5 | 48.6 |
| S/N(c) | 0.0 | 0.0 | 0.0 |
| SN(E/C) |
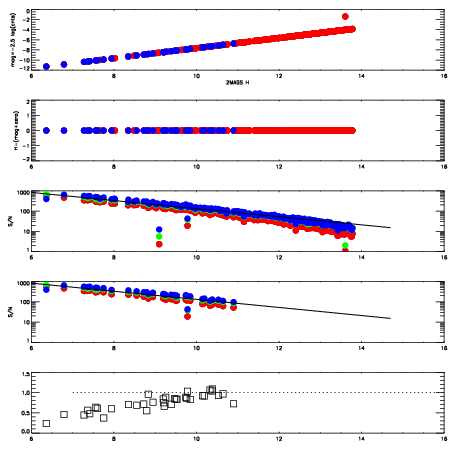
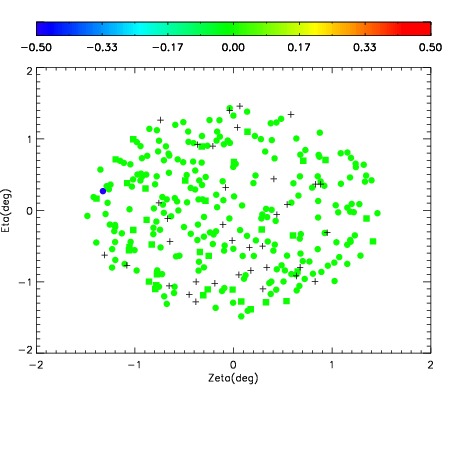
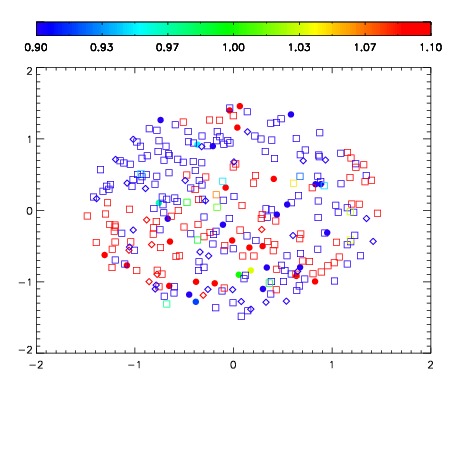


| Frame | Nreads | Zeropoints | Mag plots | Spatial mag deviation | Spatial sky 16325A emission deviations (filled: sky, open: star) | Spatial sky continuum emission | Spatial sky telluric CO2 absorption deviations (filled: H < 10) | |||||||||||||||||||||||
| 0 | 0 |
|
|
|
|
|
|
| IPAIR | NAME | SHIFT | NEWSHIFT | S/N | NAME | SHIFT | NEWSHIFT | S/N |
| 0 | 12620075 | 0.482871 | 0.00000 | 17.5011 | 12620073 | -0.000888170 | 0.483759 | 17.5933 |
| 1 | 12620071 | 0.481355 | 0.00151598 | 19.1246 | 12620069 | -0.00238353 | 0.485255 | 19.1374 |
| 2 | 12620067 | 0.480314 | 0.00255701 | 19.1214 | 12620070 | -0.00272757 | 0.485599 | 19.1176 |
| 3 | 12620068 | 0.480590 | 0.00228101 | 19.1191 | 12620066 | 0.00000 | 0.482871 | 19.0847 |
| 4 | 12620072 | 0.482174 | 0.000696987 | 18.7615 | 12620074 | -0.00134761 | 0.484219 | 18.1424 |