| Red | Green | Blue | |
| z | 17.64 | ||
| znorm | Inf | ||
| sky | -Inf | -Inf | -Inf |
| S/N | 27.6 | 46.2 | 48.1 |
| S/N(c) | 0.0 | 0.0 | 0.0 |
| SN(E/C) |
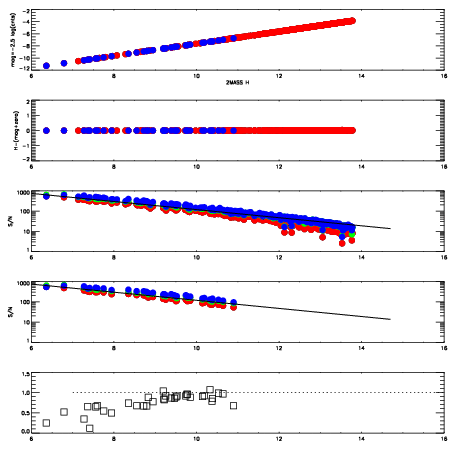


| Frame | Nreads | Zeropoints | Mag plots | Spatial mag deviation | Spatial sky 16325A emission deviations (filled: sky, open: star) | Spatial sky continuum emission | Spatial sky telluric CO2 absorption deviations (filled: H < 10) | |||||||||||||||||||||||
| 0 | 0 |
|
|
|
|
|
|
| IPAIR | NAME | SHIFT | NEWSHIFT | S/N | NAME | SHIFT | NEWSHIFT | S/N |
| 0 | 12570067 | 0.490265 | 0.00000 | 19.0100 | 12570066 | 0.00000 | 0.490265 | 18.9005 |
| 1 | 12570072 | 0.488532 | 0.00173301 | 19.1129 | 12570069 | -0.000887657 | 0.491153 | 19.1343 |
| 2 | 12570068 | 0.490229 | 3.60012e-05 | 19.1020 | 12570070 | -0.00101553 | 0.491281 | 19.1072 |
| 3 | 12570071 | 0.489118 | 0.00114700 | 19.0584 | 12570073 | -0.00278869 | 0.493054 | 19.0184 |