| Red | Green | Blue | |
| z | 17.64 | ||
| znorm | Inf | ||
| sky | -Inf | -Inf | -Inf |
| S/N | 30.1 | 46.3 | 49.0 |
| S/N(c) | 0.0 | 0.0 | 0.0 |
| SN(E/C) |
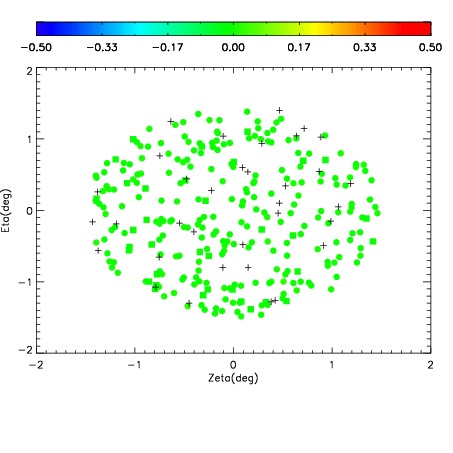
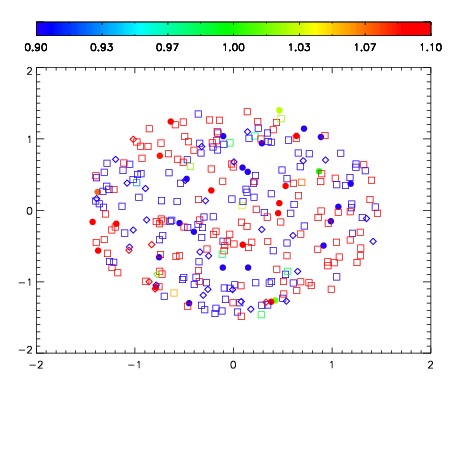


| Frame | Nreads | Zeropoints | Mag plots | Spatial mag deviation | Spatial sky 16325A emission deviations (filled: sky, open: star) | Spatial sky continuum emission | Spatial sky telluric CO2 absorption deviations (filled: H < 10) | |||||||||||||||||||||||
| 0 | 0 |
|
|
|
|
|
|
| IPAIR | NAME | SHIFT | NEWSHIFT | S/N | NAME | SHIFT | NEWSHIFT | S/N |
| 0 | 12610064 | 0.488539 | 0.00000 | 19.0961 | 12610070 | -0.000452226 | 0.488991 | 19.0794 |
| 1 | 12610065 | 0.488204 | 0.000335008 | 19.0838 | 12610066 | -0.000275815 | 0.488815 | 19.0760 |
| 2 | 12610069 | 0.484048 | 0.00449100 | 19.0794 | 12610067 | -0.000710932 | 0.489250 | 19.0744 |
| 3 | 12610068 | 0.484734 | 0.00380501 | 19.0723 | 12610063 | 0.00000 | 0.488539 | 19.0720 |