| Red | Green | Blue | |
| z | 17.63 | ||
| znorm | Inf | ||
| sky | -NaN | -NaN | -Inf |
| S/N | 26.6 | 45.7 | 48.7 |
| S/N(c) | 0.0 | 0.0 | 0.0 |
| SN(E/C) |


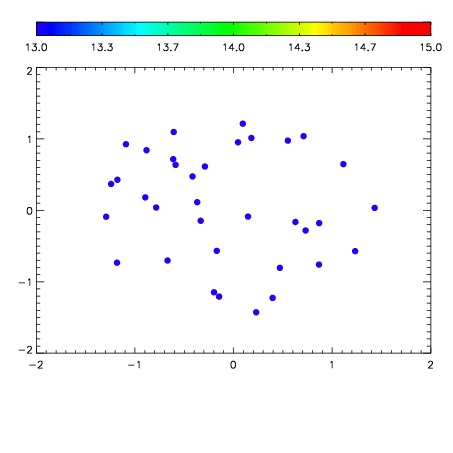

| Frame | Nreads | Zeropoints | Mag plots | Spatial mag deviation | Spatial sky 16325A emission deviations (filled: sky, open: star) | Spatial sky continuum emission | Spatial sky telluric CO2 absorption deviations (filled: H < 10) | |||||||||||||||||||||||
| 0 | 0 |
|
|
|
|
|
|
| IPAIR | NAME | SHIFT | NEWSHIFT | S/N | NAME | SHIFT | NEWSHIFT | S/N |
| 0 | 12550076 | 0.491582 | 0.00000 | 19.0471 | 12550070 | 0.00000 | 0.491582 | 18.9849 |
| 1 | 12550072 | 0.489920 | 0.00166202 | 19.1109 | 12550073 | -0.00367312 | 0.495255 | 19.1388 |
| 2 | 12550075 | 0.491164 | 0.000418007 | 19.0807 | 12550074 | -0.00366158 | 0.495244 | 19.0828 |
| 3 | 12550071 | 0.489088 | 0.00249401 | 19.0671 | 12550077 | -0.00185001 | 0.493432 | 19.0033 |