| Red | Green | Blue | |
| z | 17.64 | ||
| znorm | Inf | ||
| sky | -Inf | -NaN | -Inf |
| S/N | 28.7 | 45.4 | 51.8 |
| S/N(c) | 0.0 | 0.0 | 0.0 |
| SN(E/C) |
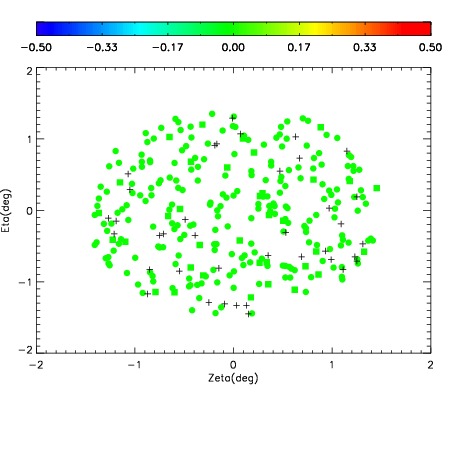
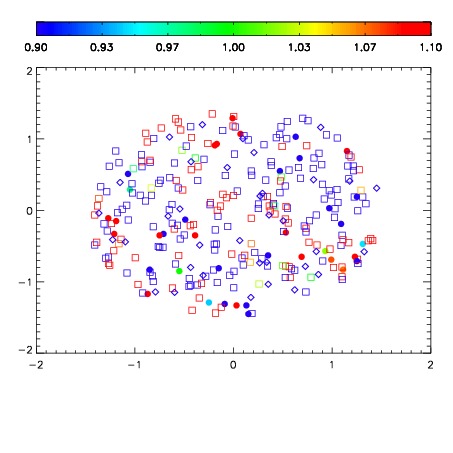
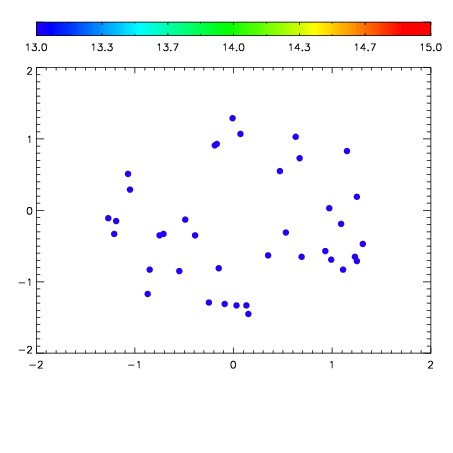

| Frame | Nreads | Zeropoints | Mag plots | Spatial mag deviation | Spatial sky 16325A emission deviations (filled: sky, open: star) | Spatial sky continuum emission | Spatial sky telluric CO2 absorption deviations (filled: H < 10) | |||||||||||||||||||||||
| 0 | 0 |
|
|
|
|
|
|
| IPAIR | NAME | SHIFT | NEWSHIFT | S/N | NAME | SHIFT | NEWSHIFT | S/N |
| 0 | 12860036 | 0.477707 | 0.00000 | 19.0960 | 12860037 | -0.00217099 | 0.479878 | 19.0955 |
| 1 | 12860040 | 0.475917 | 0.00178999 | 19.1426 | 12860041 | -0.00153938 | 0.479246 | 19.1403 |
| 2 | 12860039 | 0.475751 | 0.00195599 | 19.1104 | 12860038 | -0.00181612 | 0.479523 | 19.1162 |
| 3 | 12860035 | 0.476222 | 0.00148499 | 19.0846 | 12860034 | 0.00000 | 0.477707 | 19.0035 |