| Red | Green | Blue | |
| z | 17.64 | ||
| znorm | Inf | ||
| sky | -Inf | -Inf | -Inf |
| S/N | 24.0 | 43.0 | 48.0 |
| S/N(c) | 0.0 | 0.0 | 0.0 |
| SN(E/C) |

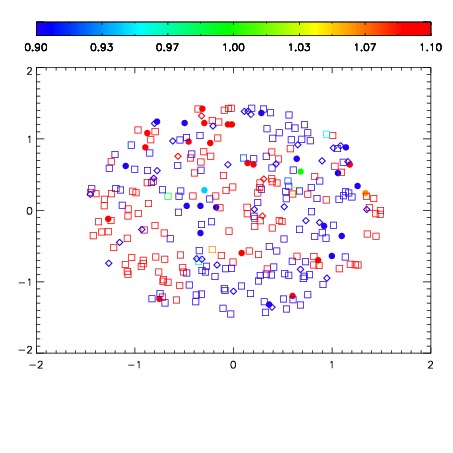
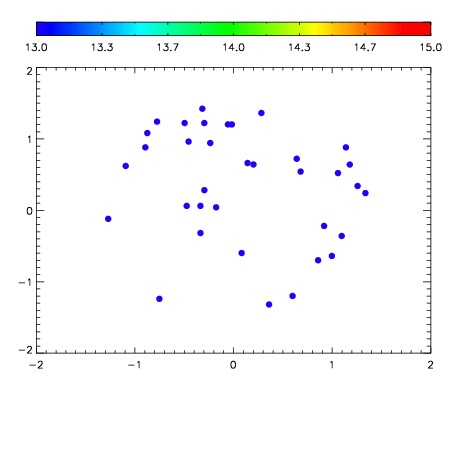

| Frame | Nreads | Zeropoints | Mag plots | Spatial mag deviation | Spatial sky 16325A emission deviations (filled: sky, open: star) | Spatial sky continuum emission | Spatial sky telluric CO2 absorption deviations (filled: H < 10) | |||||||||||||||||||||||
| 0 | 0 |
|
|
|
|
|
|
| IPAIR | NAME | SHIFT | NEWSHIFT | S/N | NAME | SHIFT | NEWSHIFT | S/N |
| 0 | 15890069 | 0.493431 | 0.00000 | 18.5796 | 15890064 | 0.00477345 | 0.488658 | 18.4348 |
| 1 | 15890066 | 0.492859 | 0.000571996 | 18.8370 | 15890056 | 0.00000 | 0.493431 | 18.8503 |
| 2 | 15890057 | 0.487985 | 0.00544602 | 18.8072 | 15890067 | 0.00456962 | 0.488861 | 18.7595 |
| 3 | 15890065 | 0.492695 | 0.000735998 | 18.7446 | 15890059 | 0.000140690 | 0.493290 | 18.7477 |
| 4 | 15890058 | 0.487632 | 0.00579900 | 18.7241 | 15890063 | 0.00417083 | 0.489260 | 18.7430 |
| 5 | 15890061 | 0.490198 | 0.00323302 | 18.7160 | 15890068 | 0.00553290 | 0.487898 | 18.6378 |
| 6 | 15890062 | 0.490091 | 0.00334001 | 18.7043 | 15890060 | 0.000987060 | 0.492444 | 18.5853 |