| Red | Green | Blue | |
| z | 17.64 | ||
| znorm | Inf | ||
| sky | -Inf | -Inf | -Inf |
| S/N | 21.2 | 38.0 | 40.9 |
| S/N(c) | 0.0 | 0.0 | 0.0 |
| SN(E/C) |

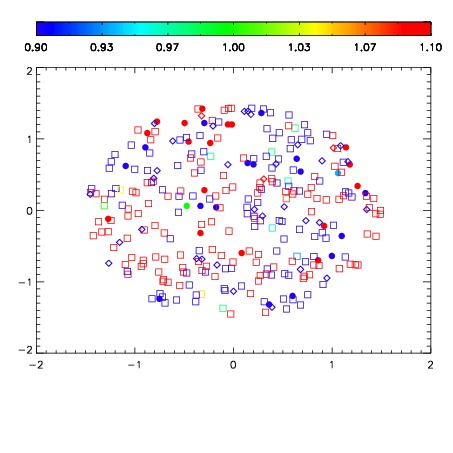
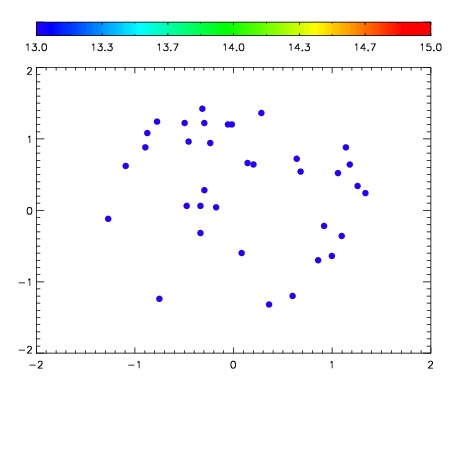

| Frame | Nreads | Zeropoints | Mag plots | Spatial mag deviation | Spatial sky 16325A emission deviations (filled: sky, open: star) | Spatial sky continuum emission | Spatial sky telluric CO2 absorption deviations (filled: H < 10) | |||||||||||||||||||||||
| 0 | 0 |
|
|
|
|
|
|
| IPAIR | NAME | SHIFT | NEWSHIFT | S/N | NAME | SHIFT | NEWSHIFT | S/N |
| 0 | 15920017 | 0.493696 | 0.00000 | 18.6631 | 15920018 | -0.000913510 | 0.494610 | 18.6126 |
| 1 | 15920013 | 0.492192 | 0.00150400 | 18.8704 | 15920014 | 0.000547726 | 0.493148 | 18.8569 |
| 2 | 15920012 | 0.491683 | 0.00201300 | 18.8545 | 15920011 | 0.00000 | 0.493696 | 18.7536 |
| 3 | 15920016 | 0.491997 | 0.00169900 | 18.6793 | 15920015 | 0.000300100 | 0.493396 | 18.6583 |