| Red | Green | Blue | |
| z | 17.64 | ||
| znorm | Inf | ||
| sky | -Inf | -Inf | -NaN |
| S/N | 18.7 | 32.2 | 35.2 |
| S/N(c) | 0.0 | 0.0 | 0.0 |
| SN(E/C) |
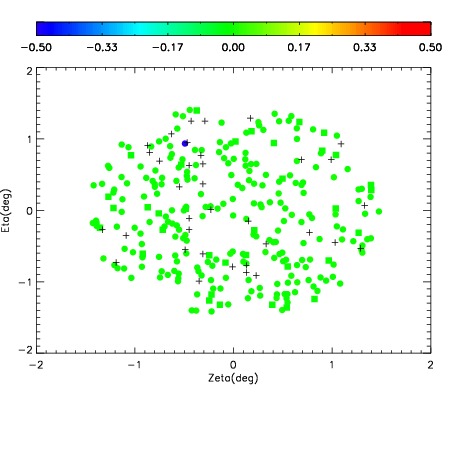
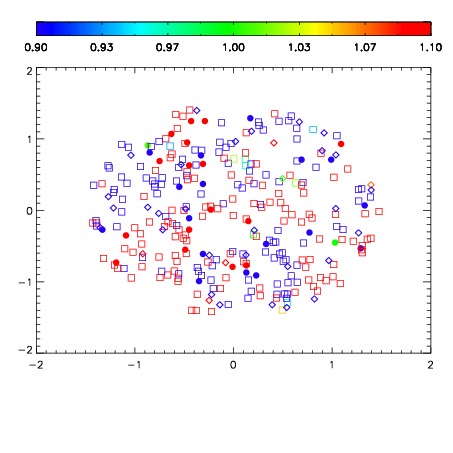


| Frame | Nreads | Zeropoints | Mag plots | Spatial mag deviation | Spatial sky 16325A emission deviations (filled: sky, open: star) | Spatial sky continuum emission | Spatial sky telluric CO2 absorption deviations (filled: H < 10) | |||||||||||||||||||||||
| 0 | 0 |
|
|
|
|
|
|
| IPAIR | NAME | SHIFT | NEWSHIFT | S/N | NAME | SHIFT | NEWSHIFT | S/N |
| 0 | 15500033 | 0.496752 | 0.00000 | 19.0768 | 15500034 | 0.00127256 | 0.495479 | 19.0660 |
| 1 | 15500032 | 0.496740 | 1.19805e-05 | 18.9496 | 15500031 | 0.00000 | 0.496752 | 18.8921 |