| Red | Green | Blue | |
| z | 17.64 | ||
| znorm | Inf | ||
| sky | -Inf | -Inf | -Inf |
| S/N | 27.1 | 46.7 | 51.4 |
| S/N(c) | 0.0 | 0.0 | 0.0 |
| SN(E/C) |
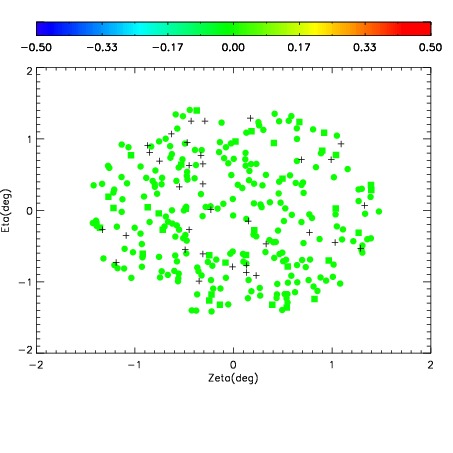
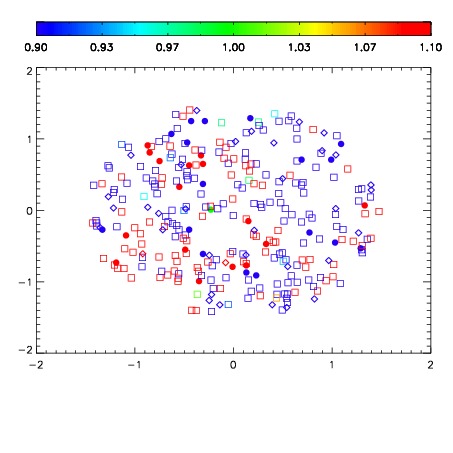
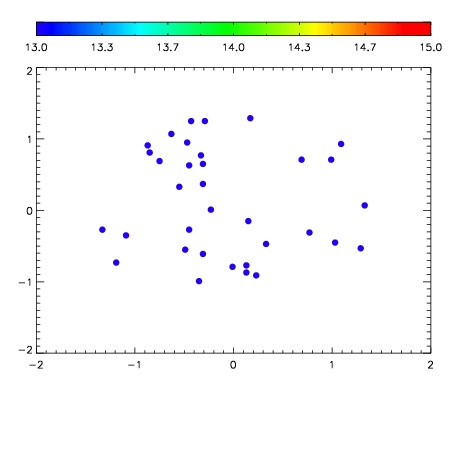

| Frame | Nreads | Zeropoints | Mag plots | Spatial mag deviation | Spatial sky 16325A emission deviations (filled: sky, open: star) | Spatial sky continuum emission | Spatial sky telluric CO2 absorption deviations (filled: H < 10) | |||||||||||||||||||||||
| 0 | 0 |
|
|
|
|
|
|
| IPAIR | NAME | SHIFT | NEWSHIFT | S/N | NAME | SHIFT | NEWSHIFT | S/N |
| 0 | 15570087 | 0.491932 | 0.00000 | 19.1297 | 15570084 | 0.00296233 | 0.488970 | 19.1068 |
| 1 | 15570086 | 0.491834 | 9.79900e-05 | 19.1613 | 15570085 | 0.00333125 | 0.488601 | 19.1282 |
| 2 | 15570083 | 0.491364 | 0.000568002 | 19.0710 | 15570088 | 0.00267050 | 0.489262 | 19.0264 |
| 3 | 15570082 | 0.491050 | 0.000882000 | 19.0186 | 15570081 | 0.00000 | 0.491932 | 18.9822 |