| Red | Green | Blue | |
| z | 17.64 | ||
| znorm | Inf | ||
| sky | -NaN | -NaN | -NaN |
| S/N | 29.6 | 45.9 | 46.2 |
| S/N(c) | 0.0 | 0.0 | 0.0 |
| SN(E/C) |
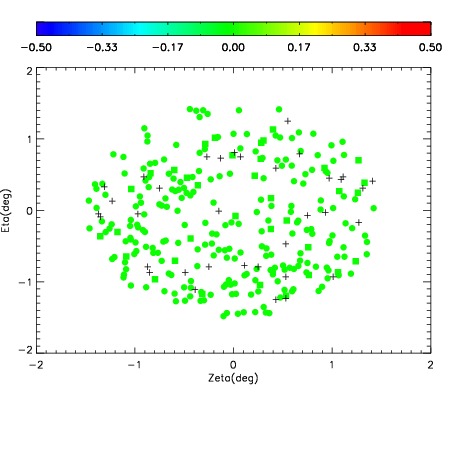
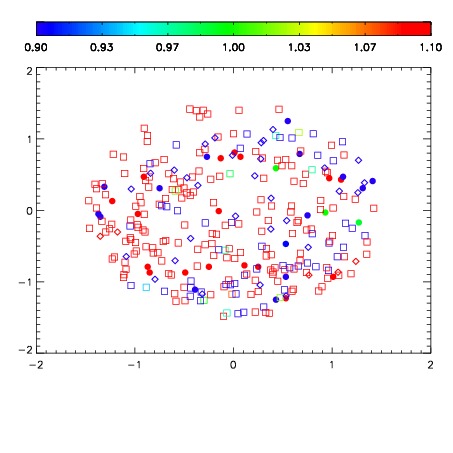
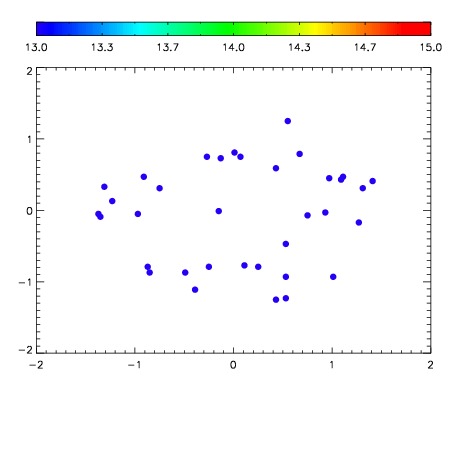

| Frame | Nreads | Zeropoints | Mag plots | Spatial mag deviation | Spatial sky 16325A emission deviations (filled: sky, open: star) | Spatial sky continuum emission | Spatial sky telluric CO2 absorption deviations (filled: H < 10) | |||||||||||||||||||||||
| 0 | 0 |
|
|
|
|
|
|
| IPAIR | NAME | SHIFT | NEWSHIFT | S/N | NAME | SHIFT | NEWSHIFT | S/N |
| 0 | 13480017 | 0.503552 | 0.00000 | 18.9658 | 13480016 | 0.00000 | 0.503552 | 18.9561 |
| 1 | 13480022 | 0.502012 | 0.00154001 | 19.0987 | 13480023 | -0.00124482 | 0.504797 | 19.1233 |
| 2 | 13480021 | 0.501903 | 0.00164902 | 19.0285 | 13480019 | -0.00111191 | 0.504664 | 19.0042 |
| 3 | 13480018 | 0.503417 | 0.000135005 | 18.9785 | 13480020 | -0.000819218 | 0.504371 | 18.9870 |