| Red | Green | Blue | |
| z | 17.64 | ||
| znorm | Inf | ||
| sky | -Inf | -Inf | -NaN |
| S/N | 22.9 | 37.4 | 40.3 |
| S/N(c) | 0.0 | 0.0 | 0.0 |
| SN(E/C) |
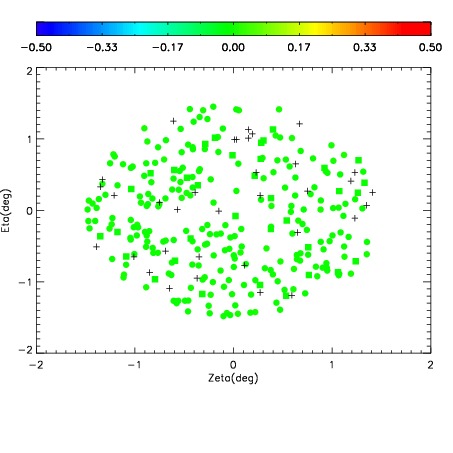
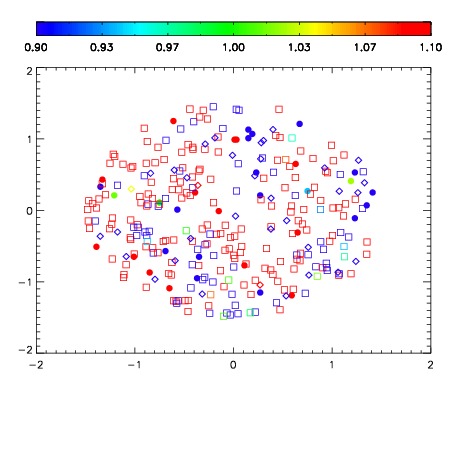
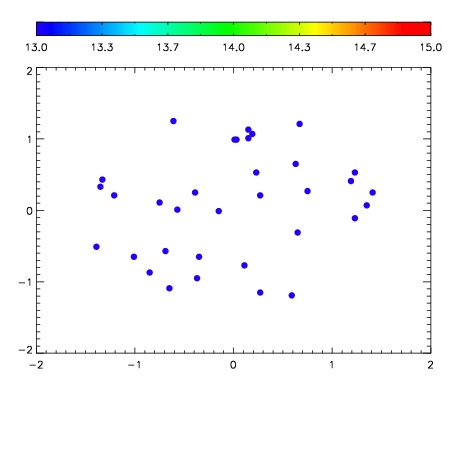

| Frame | Nreads | Zeropoints | Mag plots | Spatial mag deviation | Spatial sky 16325A emission deviations (filled: sky, open: star) | Spatial sky continuum emission | Spatial sky telluric CO2 absorption deviations (filled: H < 10) | |||||||||||||||||||||||
| 0 | 0 |
|
|
|
|
|
|
| IPAIR | NAME | SHIFT | NEWSHIFT | S/N | NAME | SHIFT | NEWSHIFT | S/N |
| 0 | 13420013 | 0.509679 | 0.00000 | 18.7804 | 13420018 | -0.00261711 | 0.512296 | 18.9490 |
| 1 | 13420012 | 0.509376 | 0.000303030 | 18.7167 | 13420015 | -0.000320875 | 0.510000 | 18.8018 |
| 2 | 13420017 | 0.506715 | 0.00296402 | 18.6729 | 13420011 | 0.00000 | 0.509679 | 18.6542 |
| 3 | 13420016 | 0.505920 | 0.00375903 | 18.6238 | 13420014 | 0.000236338 | 0.509443 | 18.6533 |