| Red | Green | Blue | |
| z | 17.64 | ||
| znorm | Inf | ||
| sky | -Inf | -Inf | -Inf |
| S/N | 23.3 | 38.4 | 41.1 |
| S/N(c) | 0.0 | 0.0 | 0.0 |
| SN(E/C) |
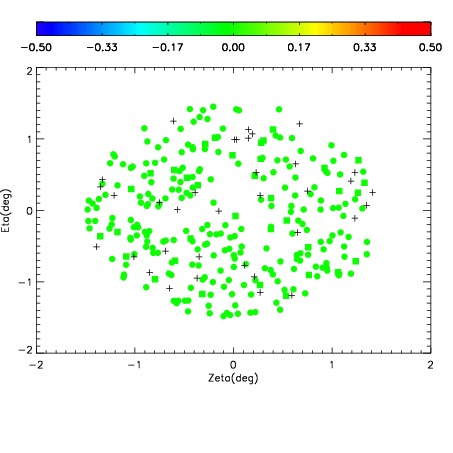
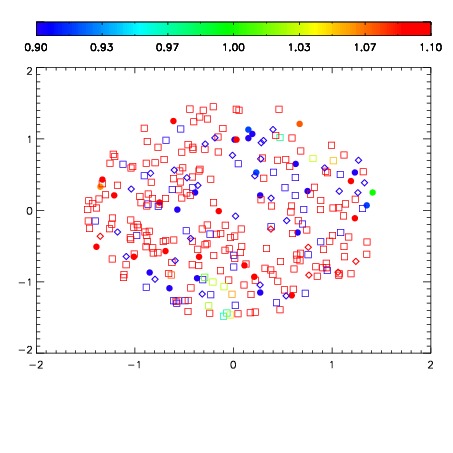
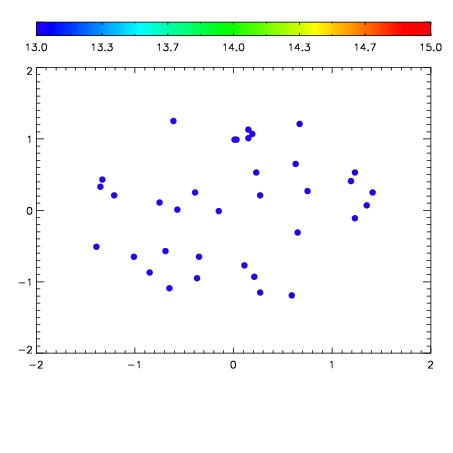

| Frame | Nreads | Zeropoints | Mag plots | Spatial mag deviation | Spatial sky 16325A emission deviations (filled: sky, open: star) | Spatial sky continuum emission | Spatial sky telluric CO2 absorption deviations (filled: H < 10) | |||||||||||||||||||||||
| 0 | 0 |
|
|
|
|
|
|
| IPAIR | NAME | SHIFT | NEWSHIFT | S/N | NAME | SHIFT | NEWSHIFT | S/N |
| 0 | 15900073 | 0.00157363 | 0.00000 | 18.7126 | 15900070 | -0.489909 | 0.491483 | 18.6761 |
| 1 | 15900076 | 0.00111608 | 0.000457550 | 18.7949 | 15900075 | -0.488833 | 0.490407 | 18.8901 |
| 2 | 15900072 | 0.00104821 | 0.000525420 | 18.7702 | 15900074 | -0.488903 | 0.490477 | 18.7032 |
| 3 | 15900069 | 0.00000 | 0.00157363 | 18.5630 | 15900071 | -0.490013 | 0.491587 | 18.6161 |