| Red | Green | Blue | |
| z | 17.64 | ||
| znorm | Inf | ||
| sky | -Inf | -NaN | -NaN |
| S/N | 28.0 | 45.4 | 48.3 |
| S/N(c) | 0.0 | 0.0 | 0.0 |
| SN(E/C) |
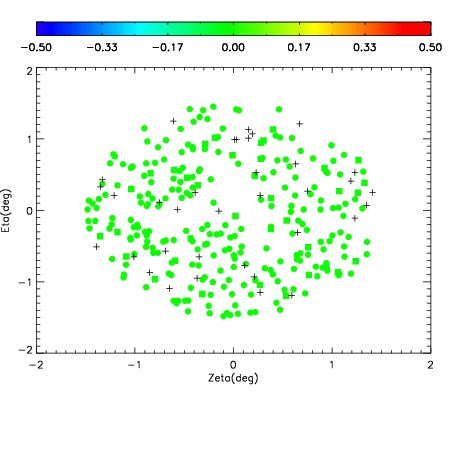
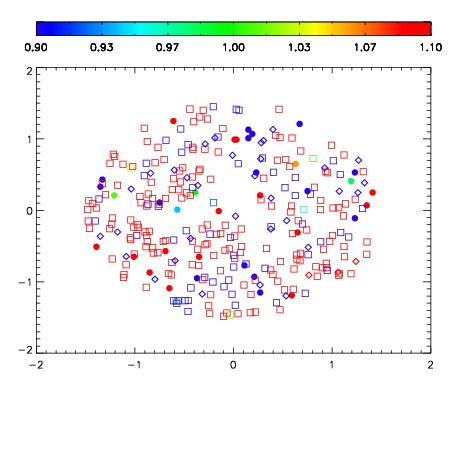


| Frame | Nreads | Zeropoints | Mag plots | Spatial mag deviation | Spatial sky 16325A emission deviations (filled: sky, open: star) | Spatial sky continuum emission | Spatial sky telluric CO2 absorption deviations (filled: H < 10) | |||||||||||||||||||||||
| 0 | 0 |
|
|
|
|
|
|
| IPAIR | NAME | SHIFT | NEWSHIFT | S/N | NAME | SHIFT | NEWSHIFT | S/N |
| 0 | 16090066 | 0.493604 | 0.00000 | 18.9732 | 16090063 | 0.00199929 | 0.491605 | 18.9569 |
| 1 | 16090062 | 0.491561 | 0.00204301 | 18.9437 | 16090067 | 0.00278443 | 0.490820 | 18.9569 |
| 2 | 16090065 | 0.493251 | 0.000353009 | 18.9414 | 16090060 | 0.00000 | 0.493604 | 18.9462 |
| 3 | 16090061 | 0.491315 | 0.00228900 | 18.9367 | 16090064 | 0.00232077 | 0.491283 | 18.9449 |