| Red | Green | Blue | |
| z | 17.64 | ||
| znorm | Inf | ||
| sky | -Inf | -Inf | -Inf |
| S/N | 27.1 | 47.7 | 49.9 |
| S/N(c) | 0.0 | 0.0 | 0.0 |
| SN(E/C) |
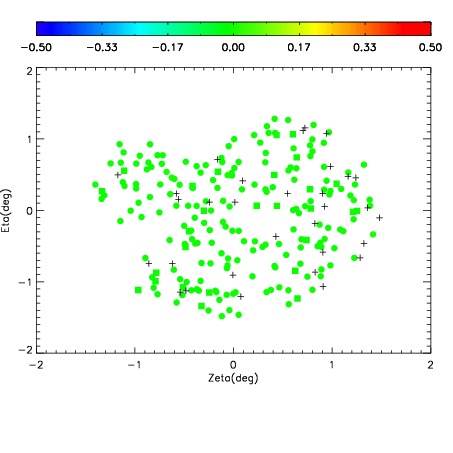
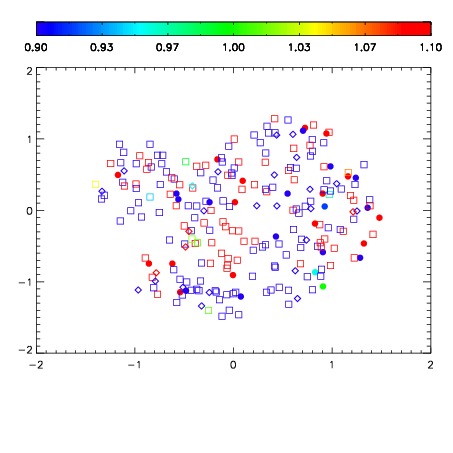


| Frame | Nreads | Zeropoints | Mag plots | Spatial mag deviation | Spatial sky 16325A emission deviations (filled: sky, open: star) | Spatial sky continuum emission | Spatial sky telluric CO2 absorption deviations (filled: H < 10) | |||||||||||||||||||||||
| 0 | 0 |
|
|
|
|
|
|
| IPAIR | NAME | SHIFT | NEWSHIFT | S/N | NAME | SHIFT | NEWSHIFT | S/N |
| 0 | 16430061 | 0.488847 | 0.00000 | 19.1409 | 16430062 | 0.000165491 | 0.488681 | 19.1846 |
| 1 | 16430057 | 0.487833 | 0.00101399 | 19.1278 | 16430059 | -8.73850e-05 | 0.488934 | 19.1262 |
| 2 | 16430060 | 0.488777 | 6.99759e-05 | 19.1173 | 16430058 | 0.000413647 | 0.488433 | 19.0977 |
| 3 | 16430056 | 0.488322 | 0.000524998 | 19.0709 | 16430055 | 0.00000 | 0.488847 | 18.9978 |