| Red | Green | Blue | |
| z | 17.64 | ||
| znorm | Inf | ||
| sky | -Inf | -NaN | -NaN |
| S/N | 24.8 | 45.8 | 50.0 |
| S/N(c) | 0.0 | 0.0 | 0.0 |
| SN(E/C) |
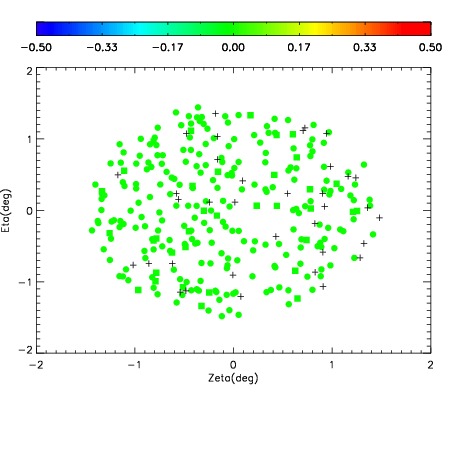
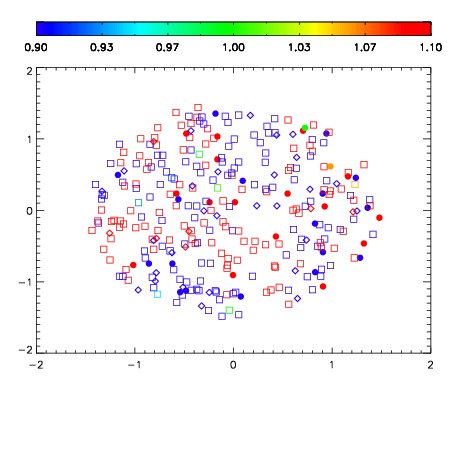
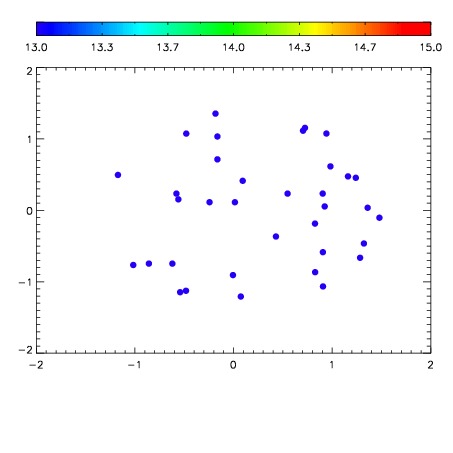

| Frame | Nreads | Zeropoints | Mag plots | Spatial mag deviation | Spatial sky 16325A emission deviations (filled: sky, open: star) | Spatial sky continuum emission | Spatial sky telluric CO2 absorption deviations (filled: H < 10) | |||||||||||||||||||||||
| 0 | 0 |
|
|
|
|
|
|
| IPAIR | NAME | SHIFT | NEWSHIFT | S/N | NAME | SHIFT | NEWSHIFT | S/N |
| 0 | 17020034 | 0.485758 | 0.00000 | 18.9142 | 17020036 | 0.000874191 | 0.484884 | 18.8681 |
| 1 | 17020033 | 0.485301 | 0.000457019 | 18.9175 | 17020032 | 0.00000 | 0.485758 | 18.9277 |
| 2 | 17020037 | 0.485076 | 0.000681996 | 18.8677 | 17020035 | 0.000729938 | 0.485028 | 18.7932 |
| 3 | 17020038 | 0.485569 | 0.000189006 | 18.7932 | 17020039 | -0.000151968 | 0.485910 | 18.7814 |