| Red | Green | Blue | |
| z | 17.64 | ||
| znorm | Inf | ||
| sky | -Inf | -Inf | -NaN |
| S/N | 14.0 | 27.0 | 29.3 |
| S/N(c) | 0.0 | 0.0 | 0.0 |
| SN(E/C) |
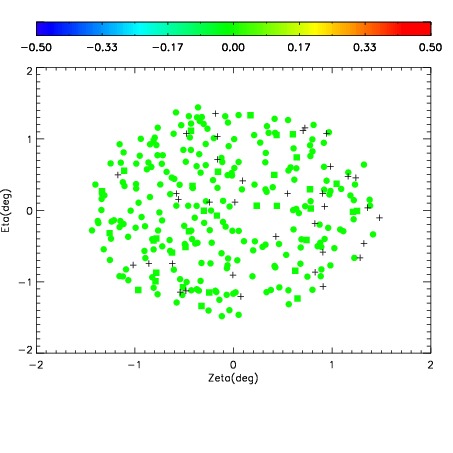
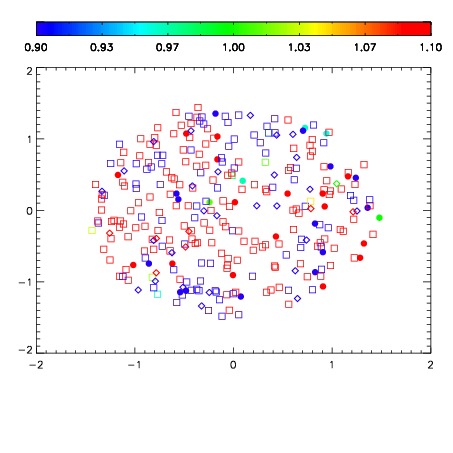


| Frame | Nreads | Zeropoints | Mag plots | Spatial mag deviation | Spatial sky 16325A emission deviations (filled: sky, open: star) | Spatial sky continuum emission | Spatial sky telluric CO2 absorption deviations (filled: H < 10) | |||||||||||||||||||||||
| 0 | 0 |
|
|
|
|
|
|
| IPAIR | NAME | SHIFT | NEWSHIFT | S/N | NAME | SHIFT | NEWSHIFT | S/N |
| 0 | 17050043 | 0.00121168 | 0.00000 | 18.4948 | 17050044 | -0.483482 | 0.484694 | 18.6423 |
| 1 | 17050042 | 0.000812836 | 0.000398844 | 18.2431 | 17050041 | -0.482171 | 0.483383 | 18.3172 |
| 2 | 17050039 | 0.00000 | 0.00121168 | 18.1436 | 17050040 | -0.482079 | 0.483291 | 17.9827 |