| Red | Green | Blue | |
| z | 17.63 | ||
| znorm | Inf | ||
| sky | -NaN | -NaN | -Inf |
| S/N | 26.8 | 42.6 | 46.8 |
| S/N(c) | 0.0 | 0.0 | 0.0 |
| SN(E/C) |
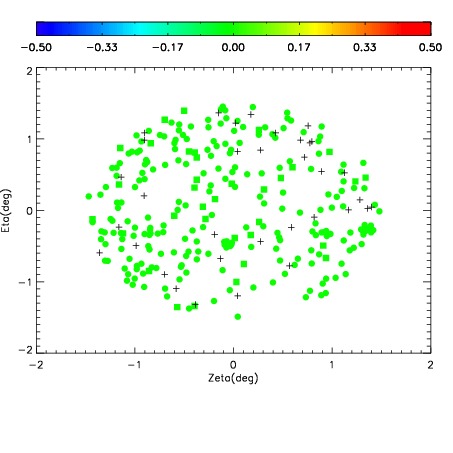
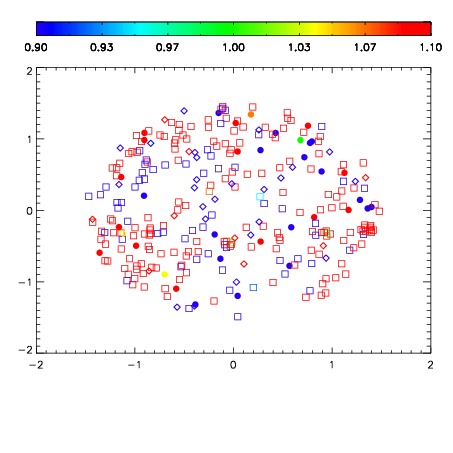
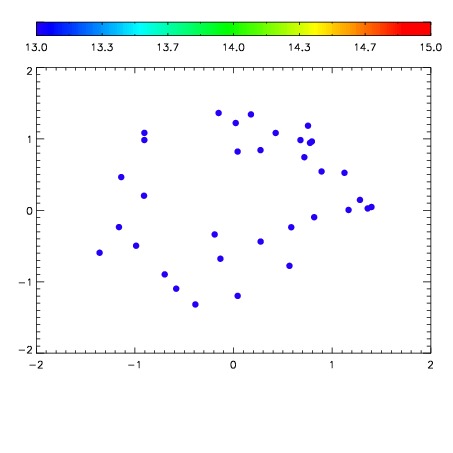

| Frame | Nreads | Zeropoints | Mag plots | Spatial mag deviation | Spatial sky 16325A emission deviations (filled: sky, open: star) | Spatial sky continuum emission | Spatial sky telluric CO2 absorption deviations (filled: H < 10) | |||||||||||||||||||||||
| 0 | 0 |
|
|
|
|
|
|
| IPAIR | NAME | SHIFT | NEWSHIFT | S/N | NAME | SHIFT | NEWSHIFT | S/N |
| 0 | 15820063 | 0.00330116 | 0.00000 | 19.0908 | 15820064 | -0.483098 | 0.486399 | 19.0610 |
| 1 | 15820062 | 0.00260299 | 0.000698170 | 19.0628 | 15820061 | -0.483859 | 0.487160 | 19.0472 |
| 2 | 15820066 | 0.00160785 | 0.00169331 | 19.0169 | 15820065 | -0.483333 | 0.486634 | 19.0173 |
| 3 | 15820059 | 0.00000 | 0.00330116 | 19.0033 | 15820060 | -0.484421 | 0.487722 | 18.9924 |