| Red | Green | Blue | |
| z | 17.63 | ||
| znorm | Inf | ||
| sky | -NaN | -NaN | -NaN |
| S/N | 26.2 | 44.6 | 48.1 |
| S/N(c) | 0.0 | 0.0 | 0.0 |
| SN(E/C) |
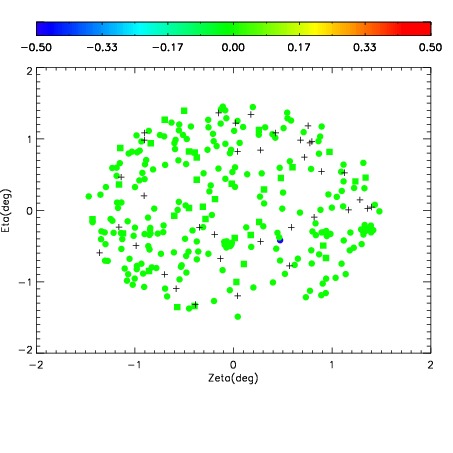
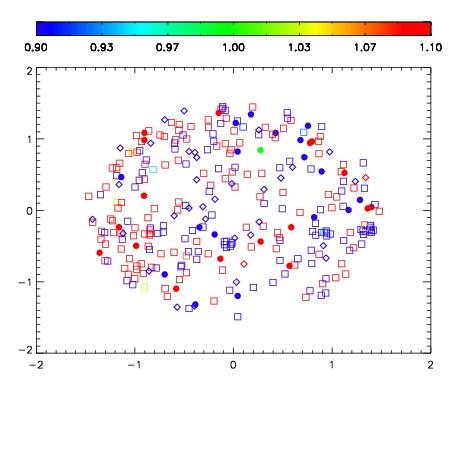
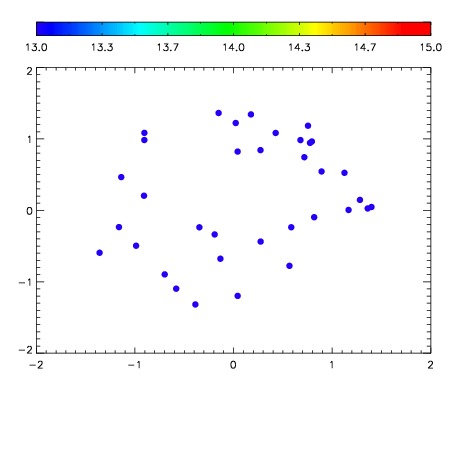

| Frame | Nreads | Zeropoints | Mag plots | Spatial mag deviation | Spatial sky 16325A emission deviations (filled: sky, open: star) | Spatial sky continuum emission | Spatial sky telluric CO2 absorption deviations (filled: H < 10) | |||||||||||||||||||||||
| 0 | 0 |
|
|
|
|
|
|
| IPAIR | NAME | SHIFT | NEWSHIFT | S/N | NAME | SHIFT | NEWSHIFT | S/N |
| 0 | 15910066 | 0.00000 | 0.00000 | 18.9880 | 15910067 | -0.491663 | 0.491663 | 19.0715 |
| 1 | 15910070 | -1.41147e-05 | 1.41147e-05 | 19.1007 | 15910071 | -0.491083 | 0.491083 | 19.1251 |
| 2 | 15910073 | -0.000600961 | 0.000600961 | 19.0777 | 15910072 | -0.490878 | 0.490878 | 19.0847 |
| 3 | 15910069 | -0.000170790 | 0.000170790 | 19.0757 | 15910068 | -0.492030 | 0.492030 | 19.0802 |