| Red | Green | Blue | |
| z | 17.64 | ||
| znorm | Inf | ||
| sky | -Inf | -Inf | -Inf |
| S/N | 23.1 | 40.9 | 43.8 |
| S/N(c) | 0.0 | 0.0 | 0.0 |
| SN(E/C) |
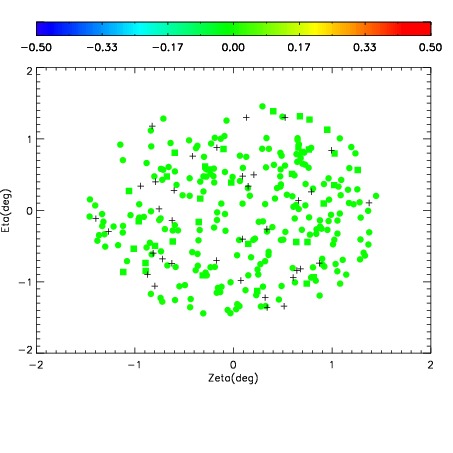
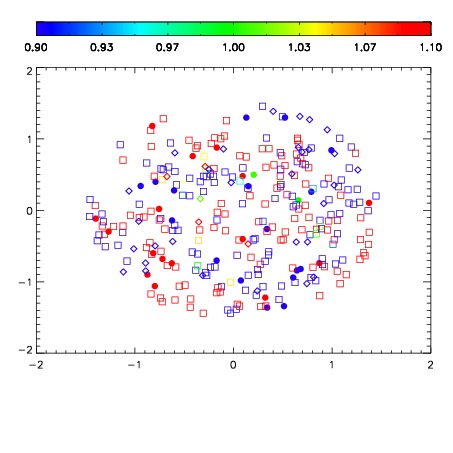
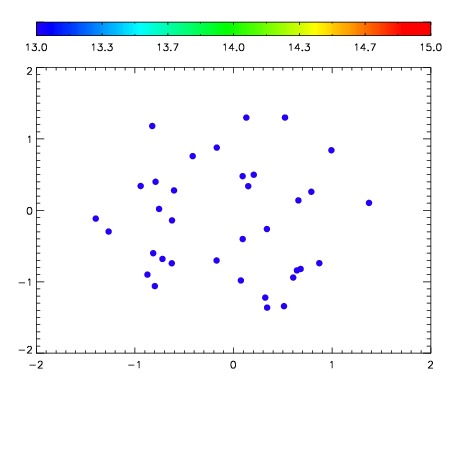

| Frame | Nreads | Zeropoints | Mag plots | Spatial mag deviation | Spatial sky 16325A emission deviations (filled: sky, open: star) | Spatial sky continuum emission | Spatial sky telluric CO2 absorption deviations (filled: H < 10) | |||||||||||||||||||||||
| 0 | 0 |
|
|
|
|
|
|
| IPAIR | NAME | SHIFT | NEWSHIFT | S/N | NAME | SHIFT | NEWSHIFT | S/N |
| 0 | 15510044 | 0.491530 | 0.00000 | 18.9566 | 15510043 | 0.00000 | 0.491530 | 18.9084 |
| 1 | 15510048 | 0.489545 | 0.00198501 | 19.1155 | 15510047 | -0.000154000 | 0.491684 | 19.0998 |
| 2 | 15510045 | 0.491381 | 0.000149012 | 19.0366 | 15510046 | 6.80018e-05 | 0.491462 | 19.0518 |