| Red | Green | Blue | |
| z | 17.64 | ||
| znorm | Inf | ||
| sky | -Inf | -Inf | -Inf |
| S/N | 26.3 | 46.2 | 49.1 |
| S/N(c) | 0.0 | 0.0 | 0.0 |
| SN(E/C) |
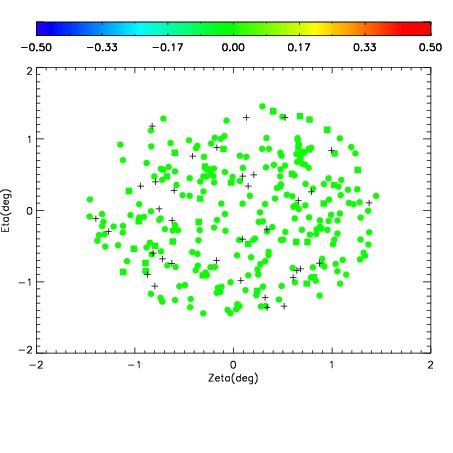
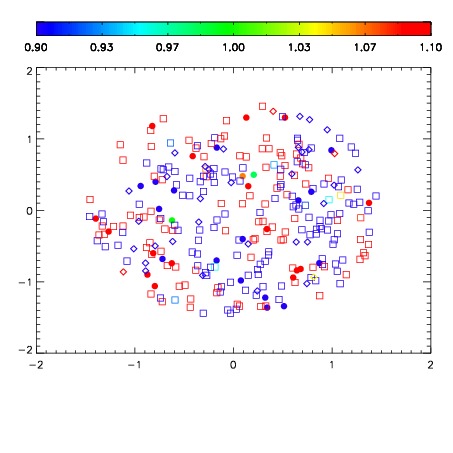


| Frame | Nreads | Zeropoints | Mag plots | Spatial mag deviation | Spatial sky 16325A emission deviations (filled: sky, open: star) | Spatial sky continuum emission | Spatial sky telluric CO2 absorption deviations (filled: H < 10) | |||||||||||||||||||||||
| 0 | 0 |
|
|
|
|
|
|
| IPAIR | NAME | SHIFT | NEWSHIFT | S/N | NAME | SHIFT | NEWSHIFT | S/N |
| 0 | 15560036 | 0.489056 | 0.00000 | 19.0752 | 15560038 | -0.000289718 | 0.489346 | 19.1151 |
| 1 | 15560037 | 0.488651 | 0.000404984 | 19.0971 | 15560042 | 9.15712e-05 | 0.488964 | 19.1357 |
| 2 | 15560041 | 0.488118 | 0.000937998 | 18.8554 | 15560035 | 0.00000 | 0.489056 | 19.0268 |
| 3 | 15560040 | 0.487370 | 0.00168598 | 18.5686 | 15560039 | -0.000885788 | 0.489942 | 18.6258 |