| Red | Green | Blue | |
| z | 17.64 | ||
| znorm | Inf | ||
| sky | -Inf | -Inf | -NaN |
| S/N | 27.7 | 48.1 | 50.0 |
| S/N(c) | 0.0 | 0.0 | 0.0 |
| SN(E/C) |
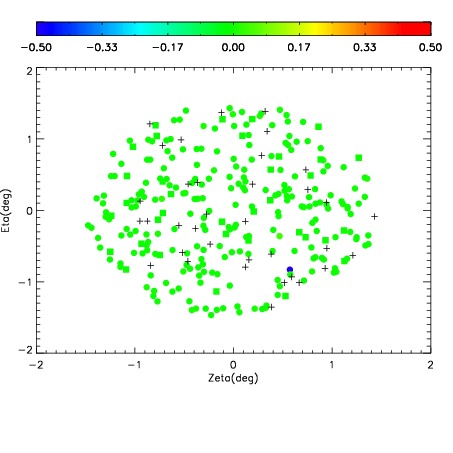
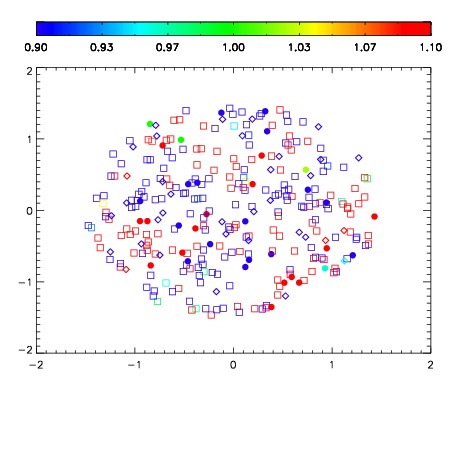
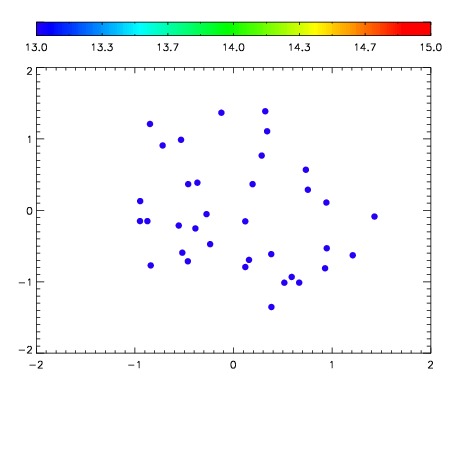

| Frame | Nreads | Zeropoints | Mag plots | Spatial mag deviation | Spatial sky 16325A emission deviations (filled: sky, open: star) | Spatial sky continuum emission | Spatial sky telluric CO2 absorption deviations (filled: H < 10) | |||||||||||||||||||||||
| 0 | 0 |
|
|
|
|
|
|
| IPAIR | NAME | SHIFT | NEWSHIFT | S/N | NAME | SHIFT | NEWSHIFT | S/N |
| 0 | 13740027 | 0.503715 | 0.00000 | 19.0719 | 13740026 | 0.00000 | 0.503715 | 19.0211 |
| 1 | 13740032 | 0.501885 | 0.00182998 | 19.1929 | 13740033 | -0.00204667 | 0.505762 | 19.2065 |
| 2 | 13740031 | 0.501441 | 0.00227398 | 19.1786 | 13740030 | -0.00166253 | 0.505378 | 19.2041 |
| 3 | 13740028 | 0.503629 | 8.59499e-05 | 19.0865 | 13740029 | -0.00135017 | 0.505065 | 19.1510 |