| Red | Green | Blue | |
| z | 17.64 | ||
| znorm | Inf | ||
| sky | -Inf | -Inf | -NaN |
| S/N | 25.7 | 45.6 | 46.2 |
| S/N(c) | 0.0 | 0.0 | 0.0 |
| SN(E/C) |
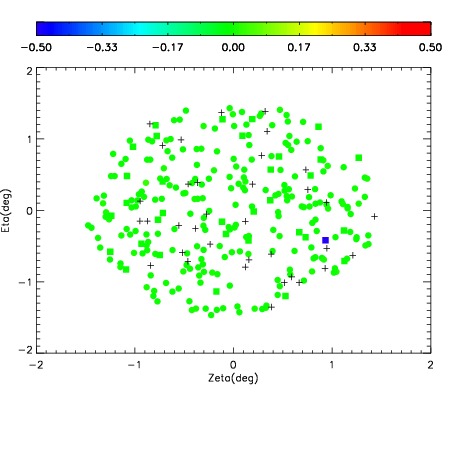


| Frame | Nreads | Zeropoints | Mag plots | Spatial mag deviation | Spatial sky 16325A emission deviations (filled: sky, open: star) | Spatial sky continuum emission | Spatial sky telluric CO2 absorption deviations (filled: H < 10) | |||||||||||||||||||||||
| 0 | 0 |
|
|
|
|
|
|
| IPAIR | NAME | SHIFT | NEWSHIFT | S/N | NAME | SHIFT | NEWSHIFT | S/N |
| 0 | 13770023 | 0.505234 | 0.00000 | 17.0319 | 13770025 | 0.000284748 | 0.504949 | 18.1950 |
| 1 | 13770032 | 0.504297 | 0.000936985 | 19.1164 | 13770030 | -0.000514714 | 0.505749 | 18.9665 |
| 2 | 13770031 | 0.503293 | 0.00194103 | 19.0635 | 13770022 | 0.00000 | 0.505234 | 18.9402 |
| 3 | 13770028 | 0.504494 | 0.000739992 | 19.0377 | 13770029 | 0.000149473 | 0.505085 | 18.5886 |
| 4 | 13770024 | 0.504482 | 0.000752032 | 19.0301 | 13770026 | -0.000186395 | 0.505420 | 18.5684 |
| 5 | 13770027 | 0.504065 | 0.00116903 | 18.7138 | 13770033 | 0.000287571 | 0.504946 | 18.4095 |