| Red | Green | Blue | |
| z | 17.64 | ||
| znorm | Inf | ||
| sky | -NaN | -NaN | -NaN |
| S/N | 23.4 | 41.3 | 43.8 |
| S/N(c) | 0.0 | 0.0 | 0.0 |
| SN(E/C) |

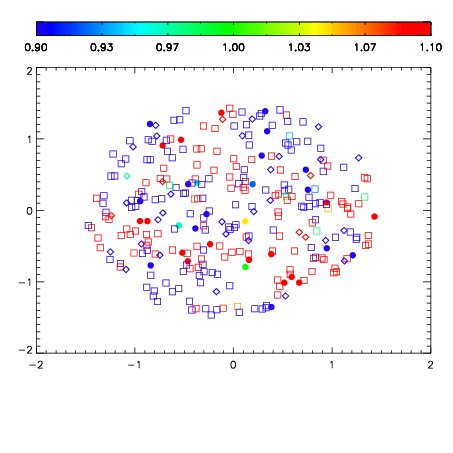
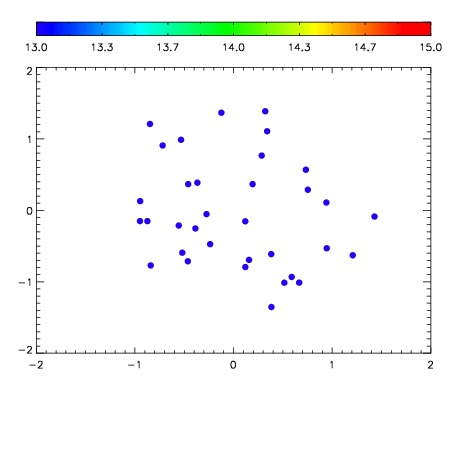

| Frame | Nreads | Zeropoints | Mag plots | Spatial mag deviation | Spatial sky 16325A emission deviations (filled: sky, open: star) | Spatial sky continuum emission | Spatial sky telluric CO2 absorption deviations (filled: H < 10) | |||||||||||||||||||||||
| 0 | 0 |
|
|
|
|
|
|
| IPAIR | NAME | SHIFT | NEWSHIFT | S/N | NAME | SHIFT | NEWSHIFT | S/N |
| 0 | 14060012 | 0.499148 | 0.00000 | 18.7107 | 14060011 | 0.00000 | 0.499148 | 18.5770 |
| 1 | 14060013 | 0.498818 | 0.000330001 | 18.9390 | 14060014 | -0.000426468 | 0.499574 | 18.8662 |
| 2 | 14060016 | 0.497535 | 0.00161302 | 18.8857 | 14060015 | -5.63650e-05 | 0.499204 | 18.8540 |
| 3 | 14060017 | 0.497728 | 0.00142002 | 18.8271 | 14060018 | 0.000858909 | 0.498289 | 18.8013 |