| Red | Green | Blue | |
| z | 17.64 | ||
| znorm | Inf | ||
| sky | -Inf | -Inf | -NaN |
| S/N | 19.8 | 34.1 | 36.0 |
| S/N(c) | 0.0 | 0.0 | 0.0 |
| SN(E/C) |
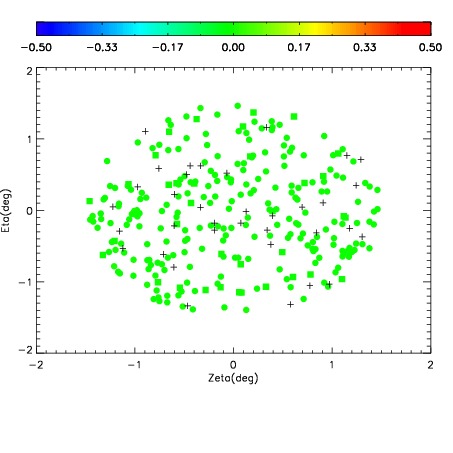
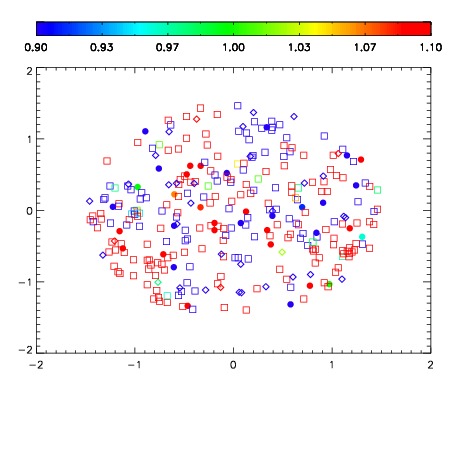
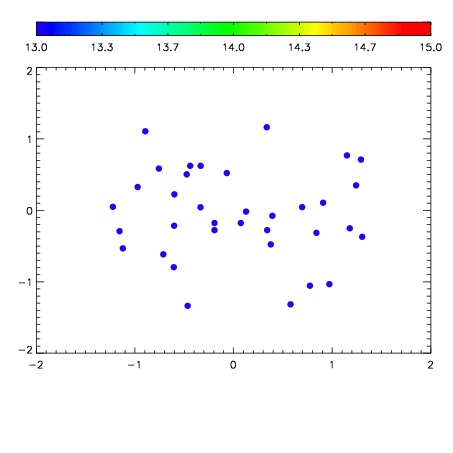

| Frame | Nreads | Zeropoints | Mag plots | Spatial mag deviation | Spatial sky 16325A emission deviations (filled: sky, open: star) | Spatial sky continuum emission | Spatial sky telluric CO2 absorption deviations (filled: H < 10) | |||||||||||||||||||||||
| 0 | 0 |
|
|
|
|
|
|
| IPAIR | NAME | SHIFT | NEWSHIFT | S/N | NAME | SHIFT | NEWSHIFT | S/N |
| 0 | 13760013 | 0.508579 | 0.00000 | 18.2800 | 13760014 | -0.000362767 | 0.508942 | 18.1330 |
| 1 | 13760017 | 0.506306 | 0.00227302 | 18.3215 | 13760015 | -0.000135965 | 0.508715 | 18.9420 |
| 2 | 13760012 | 0.508237 | 0.000342011 | 18.2878 | 13760018 | 0.000971943 | 0.507607 | 18.7303 |
| 3 | 13760016 | 0.505721 | 0.00285804 | 18.2815 | 13760011 | 0.00000 | 0.508579 | 18.6344 |