| Red | Green | Blue | |
| z | 17.64 | ||
| znorm | Inf | ||
| sky | -Inf | -Inf | -NaN |
| S/N | 24.8 | 43.6 | 44.7 |
| S/N(c) | 0.0 | 0.0 | 0.0 |
| SN(E/C) |
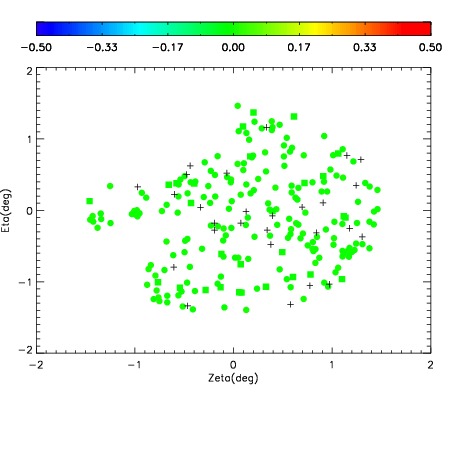
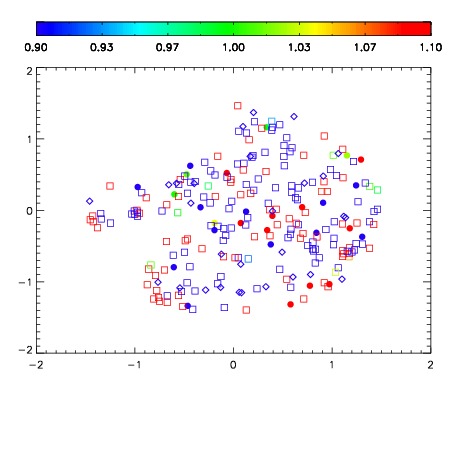
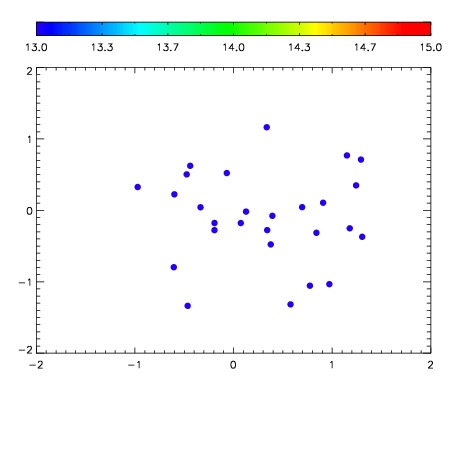

| Frame | Nreads | Zeropoints | Mag plots | Spatial mag deviation | Spatial sky 16325A emission deviations (filled: sky, open: star) | Spatial sky continuum emission | Spatial sky telluric CO2 absorption deviations (filled: H < 10) | |||||||||||||||||||||||
| 0 | 0 |
|
|
|
|
|
|
| IPAIR | NAME | SHIFT | NEWSHIFT | S/N | NAME | SHIFT | NEWSHIFT | S/N |
| 0 | 16400027 | 0.494261 | 0.00000 | 18.9751 | 16400026 | 0.00359168 | 0.490669 | 18.9515 |
| 1 | 16400028 | 0.493935 | 0.000326008 | 19.0382 | 16400029 | 0.00345026 | 0.490811 | 19.0776 |
| 2 | 16400024 | 0.493061 | 0.00119999 | 18.8339 | 16400025 | 0.00264001 | 0.491621 | 18.8151 |
| 3 | 16400023 | 0.493122 | 0.00113899 | 18.7884 | 16400022 | 0.00000 | 0.494261 | 18.6549 |