| Red | Green | Blue | |
| z | 17.64 | ||
| znorm | Inf | ||
| sky | -NaN | -Inf | -Inf |
| S/N | 32.2 | 50.7 | 54.6 |
| S/N(c) | 0.0 | 0.0 | 0.0 |
| SN(E/C) |
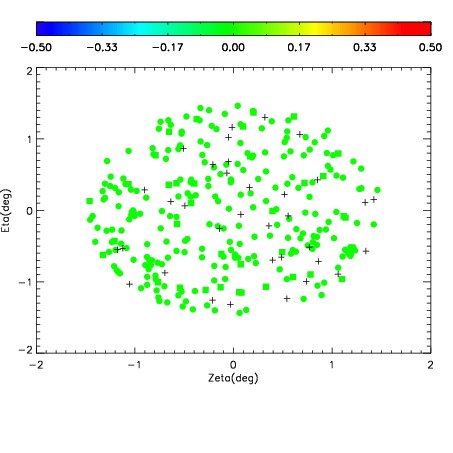
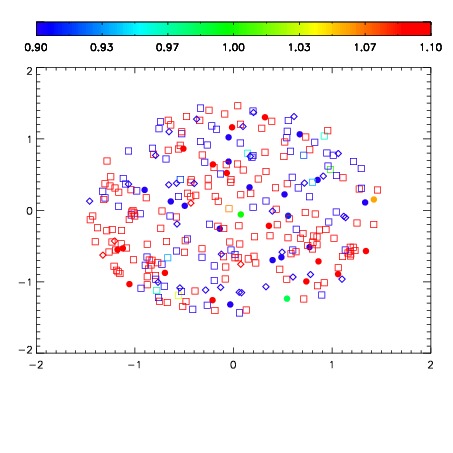
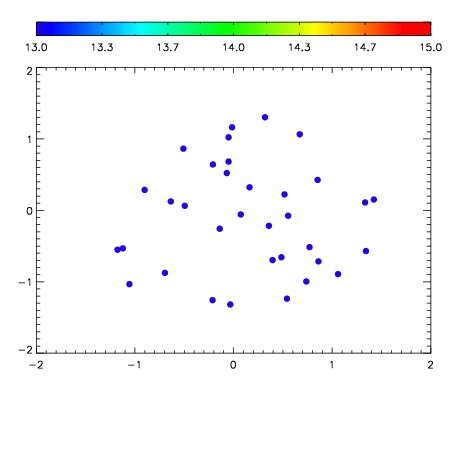

| Frame | Nreads | Zeropoints | Mag plots | Spatial mag deviation | Spatial sky 16325A emission deviations (filled: sky, open: star) | Spatial sky continuum emission | Spatial sky telluric CO2 absorption deviations (filled: H < 10) | |||||||||||||||||||||||
| 0 | 0 |
|
|
|
|
|
|
| IPAIR | NAME | SHIFT | NEWSHIFT | S/N | NAME | SHIFT | NEWSHIFT | S/N |
| 0 | 13740013 | 0.504183 | 0.00000 | 19.1063 | 13740011 | 0.00000 | 0.504183 | 19.0761 |
| 1 | 13740012 | 0.503915 | 0.000267982 | 19.0778 | 13740015 | 0.000988665 | 0.503194 | 19.0513 |
| 2 | 13740017 | 0.502368 | 0.00181502 | 19.0503 | 13740018 | 0.000436338 | 0.503747 | 19.0502 |
| 3 | 13740016 | 0.501953 | 0.00222999 | 19.0428 | 13740014 | 0.00115491 | 0.503028 | 19.0028 |