| Red | Green | Blue | |
| z | 17.64 | ||
| znorm | Inf | ||
| sky | -Inf | -Inf | -NaN |
| S/N | 31.9 | 48.5 | 52.4 |
| S/N(c) | 0.0 | 0.0 | 0.0 |
| SN(E/C) |
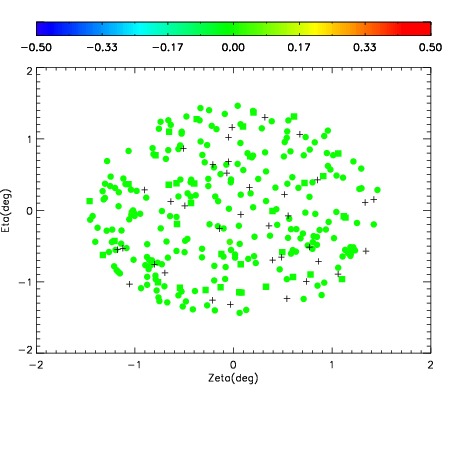
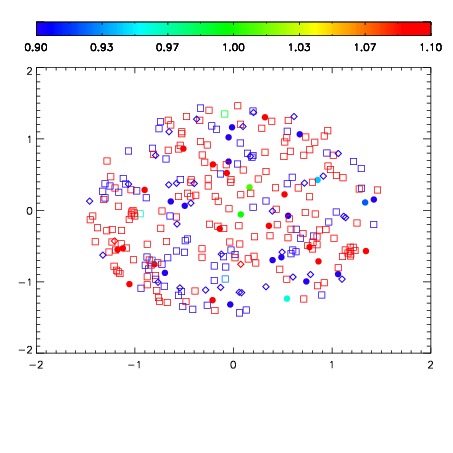
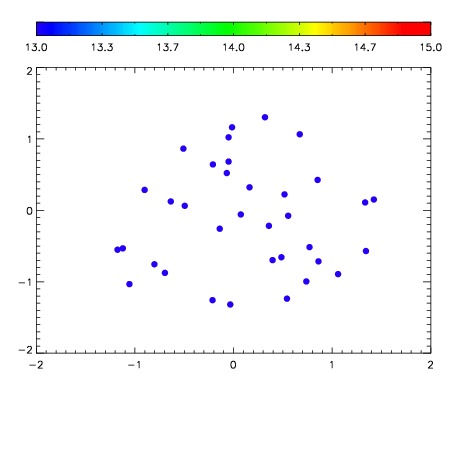

| Frame | Nreads | Zeropoints | Mag plots | Spatial mag deviation | Spatial sky 16325A emission deviations (filled: sky, open: star) | Spatial sky continuum emission | Spatial sky telluric CO2 absorption deviations (filled: H < 10) | |||||||||||||||||||||||
| 0 | 0 |
|
|
|
|
|
|
| IPAIR | NAME | SHIFT | NEWSHIFT | S/N | NAME | SHIFT | NEWSHIFT | S/N |
| 0 | 13770017 | 0.507131 | 0.00000 | 19.0995 | 13770015 | -0.000529635 | 0.507661 | 19.1207 |
| 1 | 13770016 | 0.506196 | 0.000934958 | 19.0828 | 13770014 | -0.000495645 | 0.507627 | 19.1116 |
| 2 | 13770013 | 0.505571 | 0.00155997 | 19.0416 | 13770011 | 0.00000 | 0.507131 | 19.0437 |
| 3 | 13770012 | 0.505555 | 0.00157601 | 19.0360 | 13770018 | 0.00171923 | 0.505412 | 18.6660 |