| Red | Green | Blue | |
| z | 17.64 | ||
| znorm | Inf | ||
| sky | -Inf | -Inf | -Inf |
| S/N | 29.7 | 48.8 | 50.3 |
| S/N(c) | 0.0 | 0.0 | 0.0 |
| SN(E/C) |
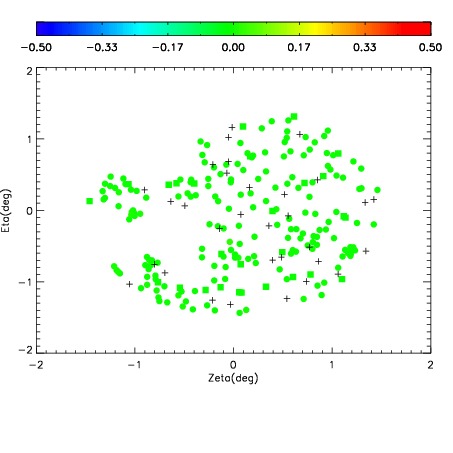
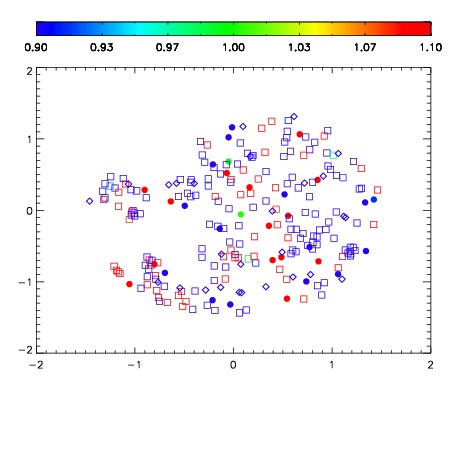


| Frame | Nreads | Zeropoints | Mag plots | Spatial mag deviation | Spatial sky 16325A emission deviations (filled: sky, open: star) | Spatial sky continuum emission | Spatial sky telluric CO2 absorption deviations (filled: H < 10) | |||||||||||||||||||||||
| 0 | 0 |
|
|
|
|
|
|
| IPAIR | NAME | SHIFT | NEWSHIFT | S/N | NAME | SHIFT | NEWSHIFT | S/N |
| 0 | 16420055 | 0.487526 | 0.00000 | 19.0091 | 16420061 | 0.00107776 | 0.486448 | 19.0507 |
| 1 | 16420056 | 0.487337 | 0.000189006 | 19.1147 | 16420057 | 2.49581e-05 | 0.487501 | 19.1087 |
| 2 | 16420060 | 0.487273 | 0.000252992 | 18.9418 | 16420054 | 0.00000 | 0.487526 | 18.9381 |
| 3 | 16420059 | 0.486928 | 0.000598013 | 18.7091 | 16420058 | 0.000300574 | 0.487225 | 18.7236 |