| Red | Green | Blue | |
| z | 17.64 | ||
| znorm | Inf | ||
| sky | -Inf | -NaN | -NaN |
| S/N | 22.4 | 39.8 | 42.5 |
| S/N(c) | 0.0 | 0.0 | 0.0 |
| SN(E/C) |
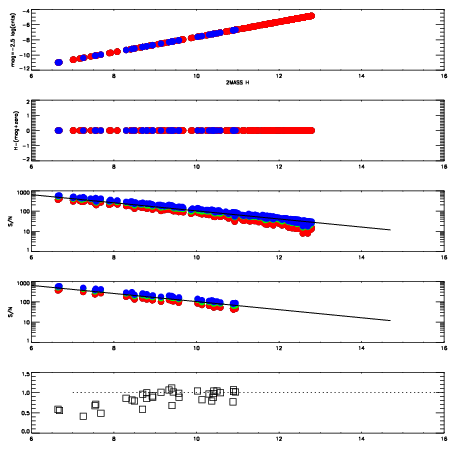
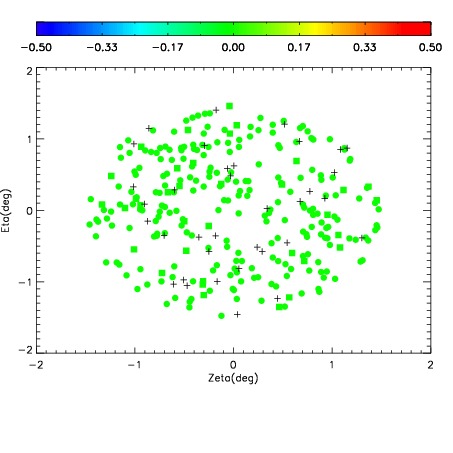
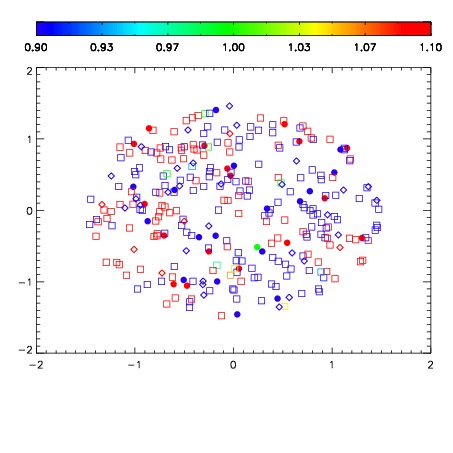


| Frame | Nreads | Zeropoints | Mag plots | Spatial mag deviation | Spatial sky 16325A emission deviations (filled: sky, open: star) | Spatial sky continuum emission | Spatial sky telluric CO2 absorption deviations (filled: H < 10) | |||||||||||||||||||||||
| 0 | 0 |
|
|
|
|
|
|
| IPAIR | NAME | SHIFT | NEWSHIFT | S/N | NAME | SHIFT | NEWSHIFT | S/N |
| 0 | 15600084 | 0.000594395 | 0.00000 | 19.0407 | 15600085 | -0.490193 | 0.490787 | 18.9806 |
| 1 | 15600083 | 0.000454596 | 0.000139799 | 18.9879 | 15600082 | -0.488549 | 0.489143 | 18.8735 |
| 2 | 15600080 | 0.00000 | 0.000594395 | 18.8353 | 15600081 | -0.488878 | 0.489472 | 18.8571 |