| Red | Green | Blue | |
| z | 17.64 | ||
| znorm | Inf | ||
| sky | -Inf | -Inf | -Inf |
| S/N | 28.4 | 49.2 | 54.0 |
| S/N(c) | 0.0 | 0.0 | 0.0 |
| SN(E/C) |
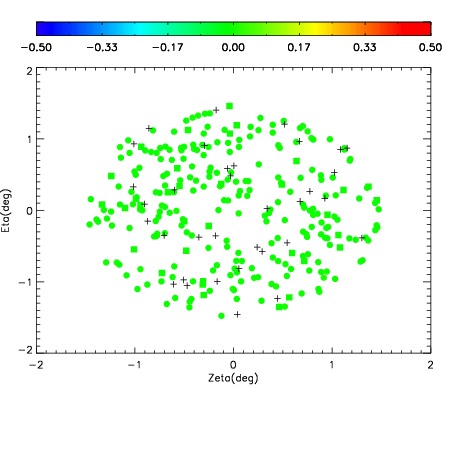
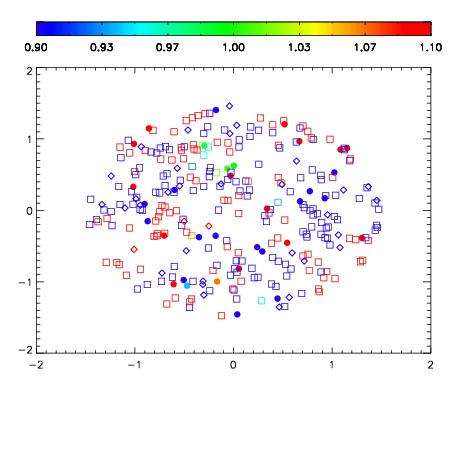
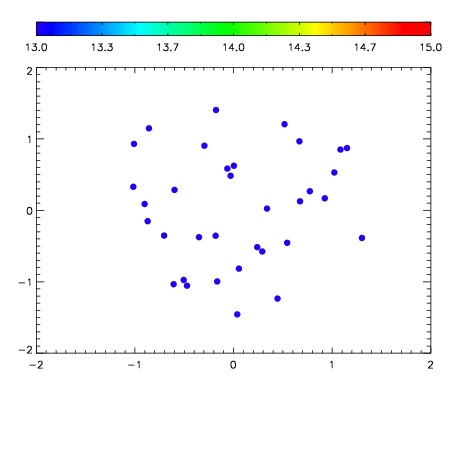

| Frame | Nreads | Zeropoints | Mag plots | Spatial mag deviation | Spatial sky 16325A emission deviations (filled: sky, open: star) | Spatial sky continuum emission | Spatial sky telluric CO2 absorption deviations (filled: H < 10) | |||||||||||||||||||||||
| 0 | 0 |
|
|
|
|
|
|
| IPAIR | NAME | SHIFT | NEWSHIFT | S/N | NAME | SHIFT | NEWSHIFT | S/N |
| 0 | 15810066 | 0.000649939 | 0.00000 | 19.0624 | 15810065 | -0.483933 | 0.484583 | 19.1352 |
| 1 | 15810067 | 0.000634069 | 1.58700e-05 | 19.1066 | 15810069 | -0.484649 | 0.485299 | 19.1625 |
| 2 | 15810070 | -0.000270806 | 0.000920745 | 19.0942 | 15810068 | -0.484339 | 0.484989 | 19.1566 |
| 3 | 15810063 | 0.00000 | 0.000649939 | 19.0478 | 15810064 | -0.484877 | 0.485527 | 19.0639 |