| Red | Green | Blue | |
| z | 17.64 | ||
| znorm | Inf | ||
| sky | -NaN | -NaN | -NaN |
| S/N | 19.2 | 32.7 | 36.7 |
| S/N(c) | 0.0 | 0.0 | 0.0 |
| SN(E/C) |
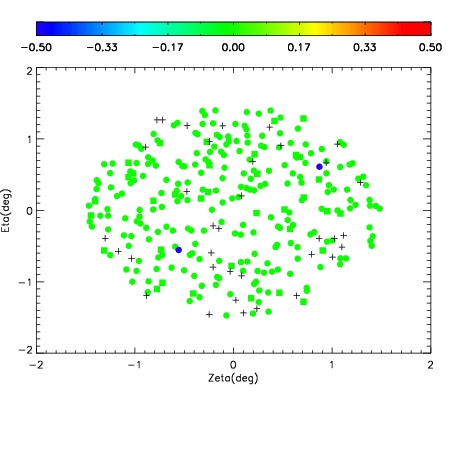
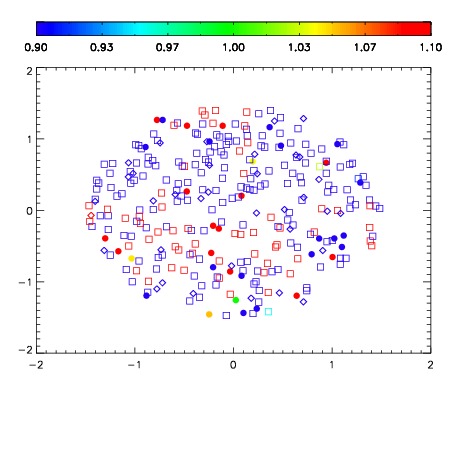
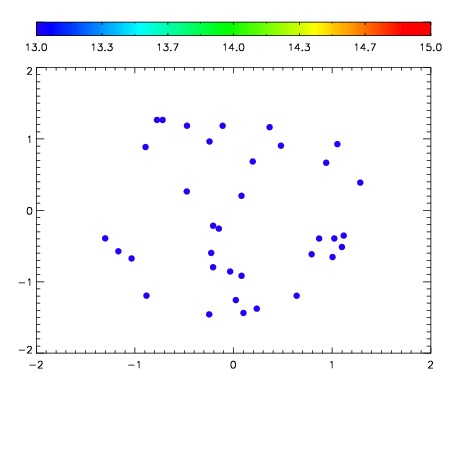

| Frame | Nreads | Zeropoints | Mag plots | Spatial mag deviation | Spatial sky 16325A emission deviations (filled: sky, open: star) | Spatial sky continuum emission | Spatial sky telluric CO2 absorption deviations (filled: H < 10) | |||||||||||||||||||||||
| 0 | 0 |
|
|
|
|
|
|
| IPAIR | NAME | SHIFT | NEWSHIFT | S/N | NAME | SHIFT | NEWSHIFT | S/N |
| 0 | 13410049 | 0.505018 | 0.00000 | 19.0311 | 13410048 | 0.00000 | 0.505018 | 19.0171 |
| 1 | 13410050 | 0.504767 | 0.000250995 | 19.1036 | 13410051 | -0.00137680 | 0.506395 | 19.0776 |