| Red | Green | Blue | |
| z | 17.64 | ||
| znorm | Inf | ||
| sky | -Inf | -Inf | -Inf |
| S/N | 31.7 | 49.9 | 50.8 |
| S/N(c) | 0.0 | 0.0 | 0.0 |
| SN(E/C) |
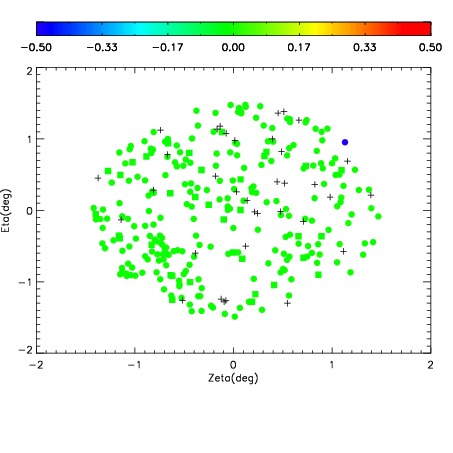
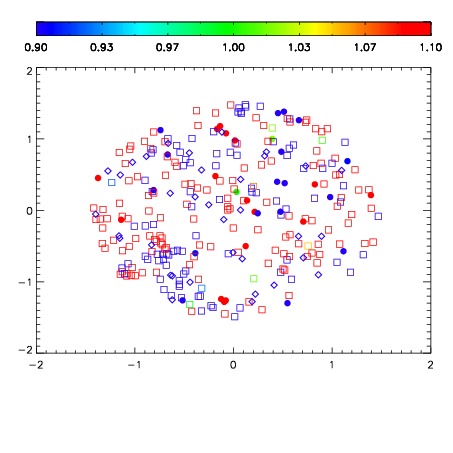
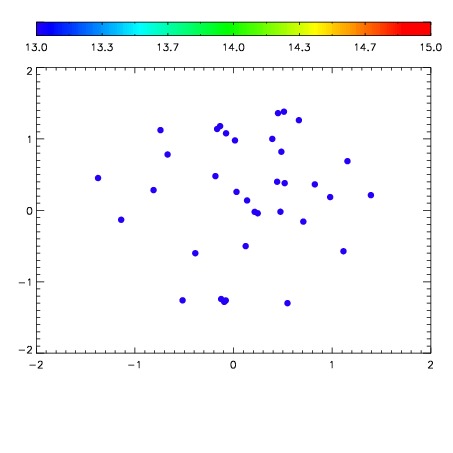

| Frame | Nreads | Zeropoints | Mag plots | Spatial mag deviation | Spatial sky 16325A emission deviations (filled: sky, open: star) | Spatial sky continuum emission | Spatial sky telluric CO2 absorption deviations (filled: H < 10) | |||||||||||||||||||||||
| 0 | 0 |
|
|
|
|
|
|
| IPAIR | NAME | SHIFT | NEWSHIFT | S/N | NAME | SHIFT | NEWSHIFT | S/N |
| 0 | 13720028 | 0.501286 | 0.00000 | 19.1738 | 13720033 | -0.000403114 | 0.501689 | 19.1945 |
| 1 | 13720032 | 0.501219 | 6.69956e-05 | 19.1705 | 13720029 | -0.000675822 | 0.501962 | 19.1741 |
| 2 | 13720031 | 0.500817 | 0.000468969 | 19.1542 | 13720026 | 0.00000 | 0.501286 | 19.1695 |
| 3 | 13720027 | 0.500637 | 0.000648975 | 19.1374 | 13720030 | -0.000420658 | 0.501707 | 19.1471 |