| Red | Green | Blue | |
| z | 17.64 | ||
| znorm | Inf | ||
| sky | -NaN | -NaN | -Inf |
| S/N | 21.0 | 33.2 | 32.7 |
| S/N(c) | 0.0 | 0.0 | 0.0 |
| SN(E/C) |
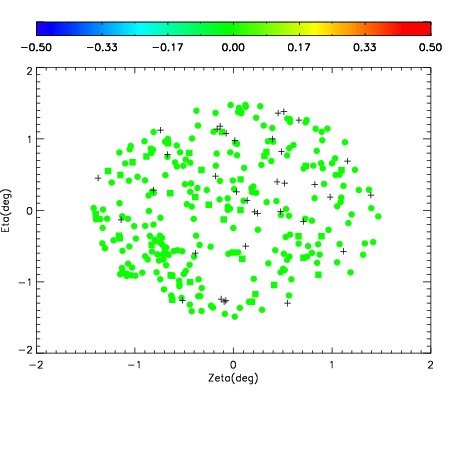
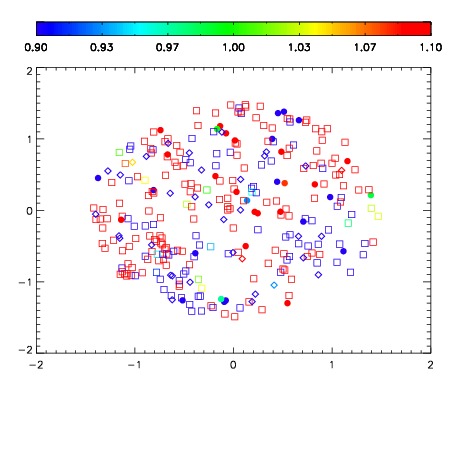
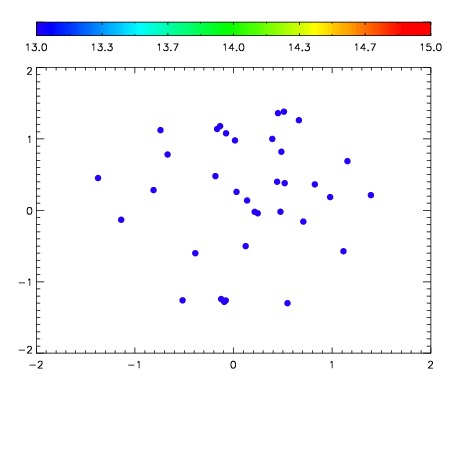

| Frame | Nreads | Zeropoints | Mag plots | Spatial mag deviation | Spatial sky 16325A emission deviations (filled: sky, open: star) | Spatial sky continuum emission | Spatial sky telluric CO2 absorption deviations (filled: H < 10) | |||||||||||||||||||||||
| 0 | 0 |
|
|
|
|
|
|
| IPAIR | NAME | SHIFT | NEWSHIFT | S/N | NAME | SHIFT | NEWSHIFT | S/N |
| 0 | 13750037 | 0.505327 | 0.00000 | 18.6317 | 13750038 | -0.00189377 | 0.507221 | 18.5286 |
| 1 | 13750040 | 0.502313 | 0.00301397 | 18.7175 | 13750039 | -0.00264536 | 0.507972 | 18.7203 |
| 2 | 13750041 | 0.502536 | 0.00279099 | 18.7162 | 13750042 | -0.00157310 | 0.506900 | 18.5614 |
| 3 | 13750036 | 0.504948 | 0.000378966 | 18.6626 | 13750035 | 0.00000 | 0.505327 | 18.5512 |