| Red | Green | Blue | |
| z | 17.64 | ||
| znorm | Inf | ||
| sky | -Inf | -Inf | -Inf |
| S/N | 12.0 | 20.6 | 18.8 |
| S/N(c) | 0.0 | 0.0 | 0.0 |
| SN(E/C) |
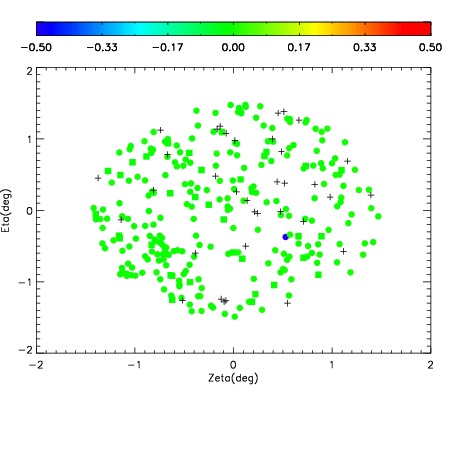
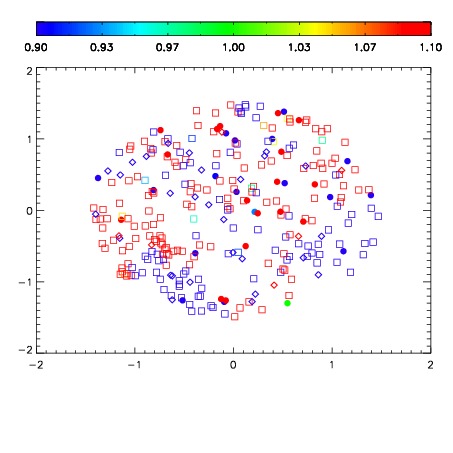
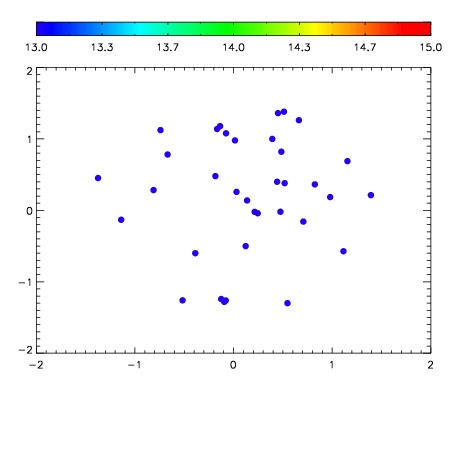

| Frame | Nreads | Zeropoints | Mag plots | Spatial mag deviation | Spatial sky 16325A emission deviations (filled: sky, open: star) | Spatial sky continuum emission | Spatial sky telluric CO2 absorption deviations (filled: H < 10) | |||||||||||||||||||||||
| 0 | 0 |
|
|
|
|
|
|
| IPAIR | NAME | SHIFT | NEWSHIFT | S/N | NAME | SHIFT | NEWSHIFT | S/N |
| 0 | 14000024 | 0.500119 | 0.00000 | 18.3011 | 14000026 | 0.000722422 | 0.499397 | 17.9498 |
| 1 | 14000023 | 0.499094 | 0.00102496 | 18.3940 | 14000025 | 0.000770524 | 0.499348 | 18.4420 |
| 2 | 14000027 | 0.499491 | 0.000627965 | 15.7942 | 14000022 | 0.00000 | 0.500119 | 17.9281 |